"...Goldman has seen its share of Principal trading go from 60% all the way into 90%: a vast majority of all its trades are merely for its own benefit (and potentially as an SLP funnel)."
NOTE: read the article for a definition of SLP, it's the point of the whole post.
"...while the total amount of total Principal trading as a portion of NYSE PT has stayed relatively flat, at about half of total PT volumes, Goldman's share has exploded over the past six months: while GS was responsible for around 27% of Principal NYSE stock trading in Q3 and most of Q4, that number has risen to the low 50% range over the past 3 months."
"...traditional market neutral, high-frequency quants, aka independent liquidity providers have not only suffered significant P&L losses in April, but have deleveraged to a point where their presence in the market is negligible, resulting in dramatic volatility spikes on low volume. Could it be that Goldman is singlehandedly benefitting from being the liquidity provider of last resort, even more so as there are virtually no other participants in the SLP program? And, as is expected, with a liquidity "monopoly", come unprecedented opportunities to take advantage of this, depending on one's view of the market."
Thanks to Tyler Durden for excellent work. This has helped expand my knowlege about the rumors and scoffs of GS. However, this raises new fears and questions: is GS responsible for the Return of the Financials? (maybe it's really only the Bailout Money) Maybe this only means that GS is enjoying a certain monopoly on high-volume trading. But, whatever it is, those guys in the know...the full-timers, aren't too happy. So, I'll be keeping an eye out for more updates on these events. There is definitely a concerted effort to make GS seem like the new Evil That Must Be Stopped, or at least shorted someday.
--------------------------------------------------------------
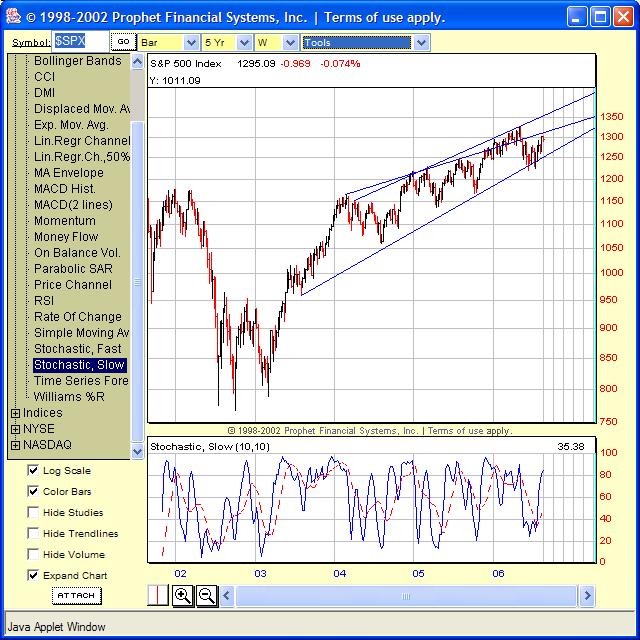
As for trading, I found STM through iBankCoin.com.

At first, I saw the rising wedge, but I also see a sideways channel or flag potentially forming.

The daily chart shows RSI (pink) weakness getting stronger, and breaking down away from the momentum (green). It made a similar break to the upside in early March, so I'm guessing this stock is about to go down. Oh yeah, and it's Swine Flu-related. I would short the Swine Flu if it had an ETF right now.