"Well, the answer is it can, but it takes a lot. "
--Dr. David Blanchflower, Dartmouth College
Sunday, Feb. 12, 2006 in an interview with James Reese on RadioEconomics.com.
How about that real estate bust goin' down? I'm reading more and more articles about developers pulling out of projects, mounting new home inventories, and falling prices. Is this a good time to become a landlord in my area? And what about all those houses built with immigrant labor in a hurry? How's the quality going to be a few years down the road?
I think this week will be a moment of truth for the markets. After last week's rally, will we see a full turnaround this week? I'm still bearish, myself.
Monday, July 31, 2006
Thursday, July 27, 2006
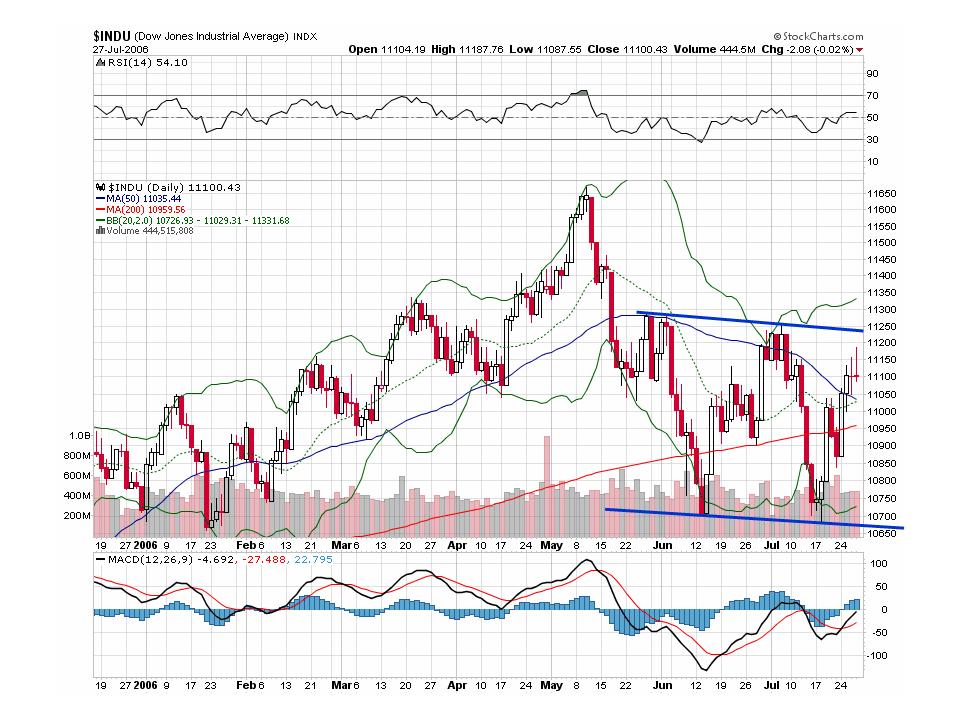
The Current Index Picture; for reference
Dow Jones Industrial Average

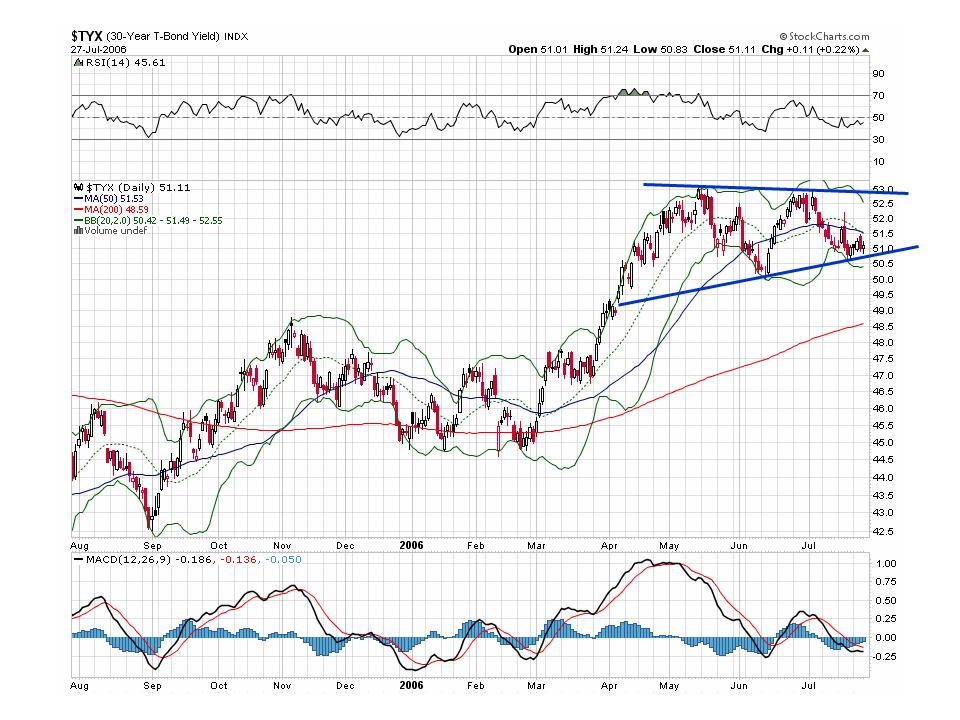
30-yr Bond

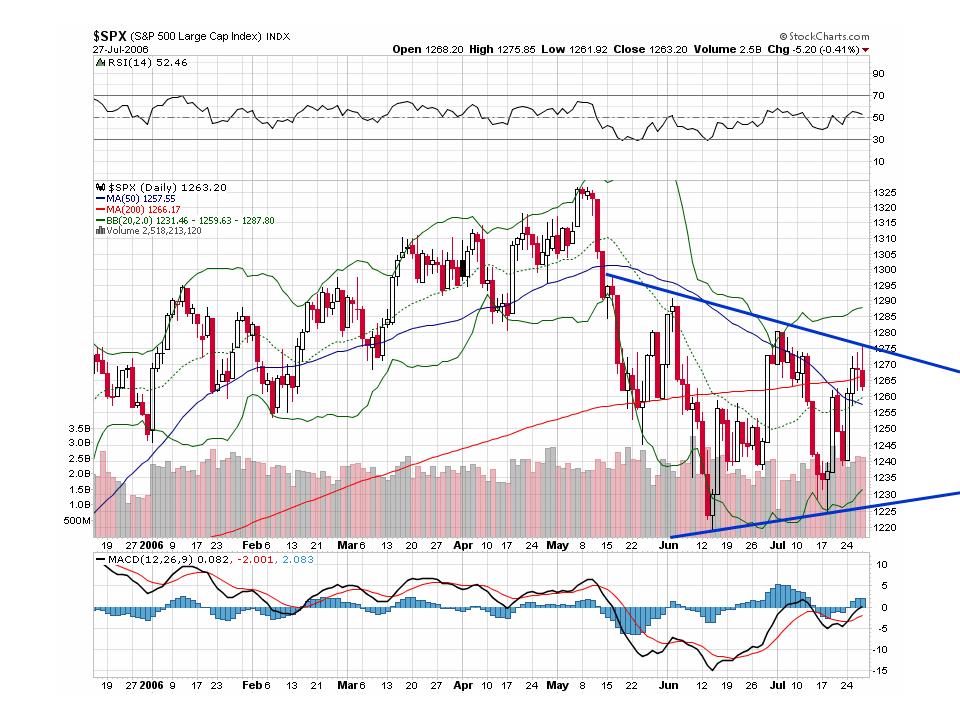
S&P 500

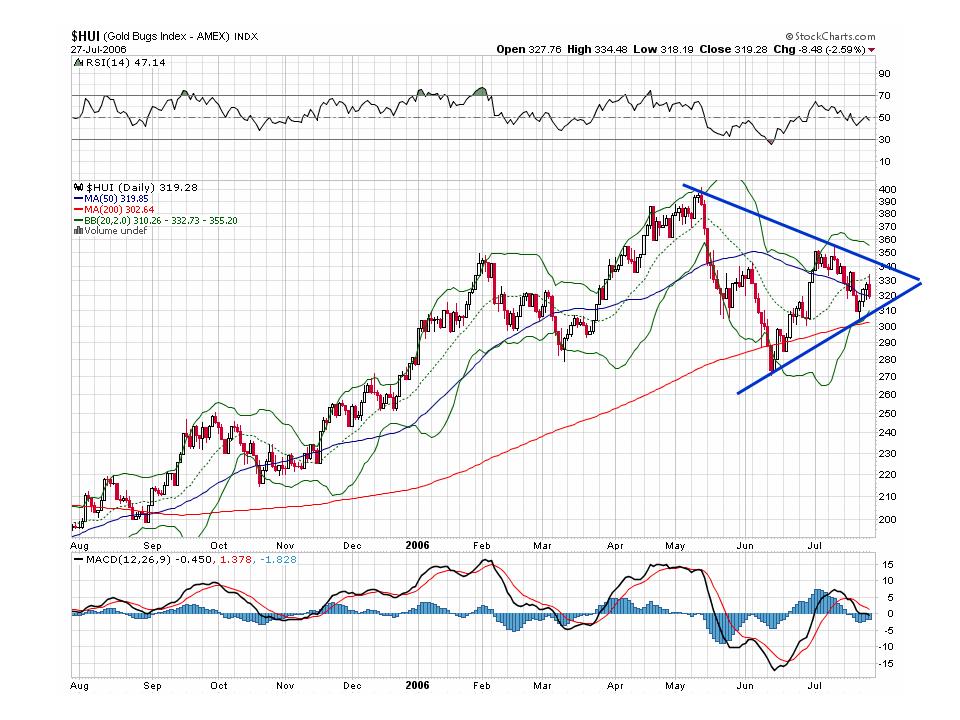
Gold Bug Index

Dow Jones Utilities Index

30-yr Bond
S&P 500
Gold Bug Index
Dow Jones Utilities Index
Monday, July 24, 2006
Stocks for Tuesday
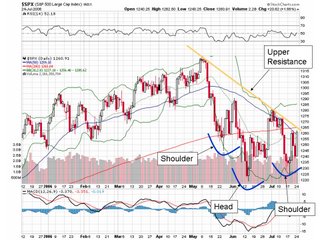
Here's the StockCharts.com charts that I promised. They might get cleaner in time, but here's first the updated S&P 500 chart, demonstrating my theory on the Inverse Head & Shoulder's coming up. Notice it's still within bounds
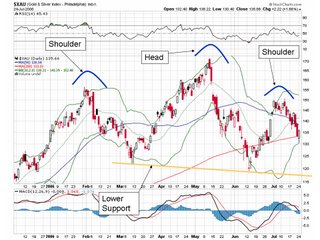
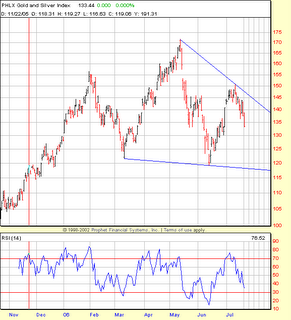
Next, is the Gold & Silver Index. I've outlined the normal Head & Shoulders that I see. I suppose it makes sense that it's moving opposite stocks, since Gold is a defence to falling stock prices.
Here's the sum of the stuff from yesterday. ACO & ERTH stayed within bounds, and aren't going anywhere spectacular for tomorrow.

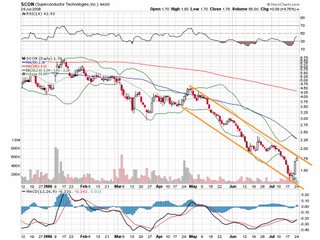
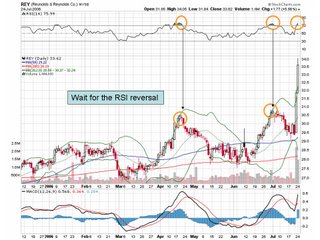
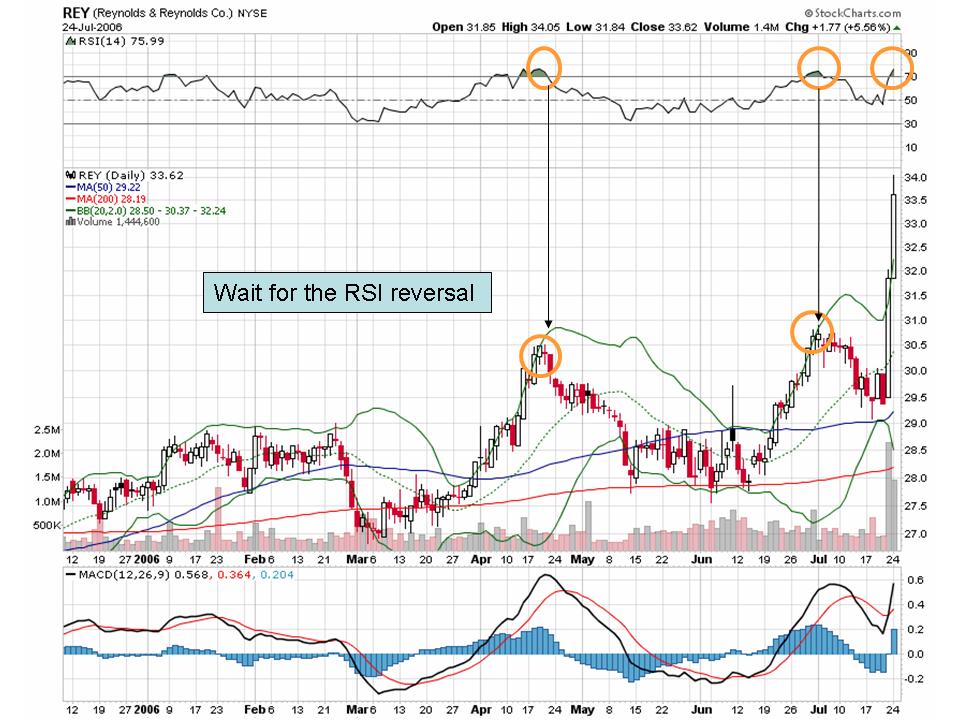
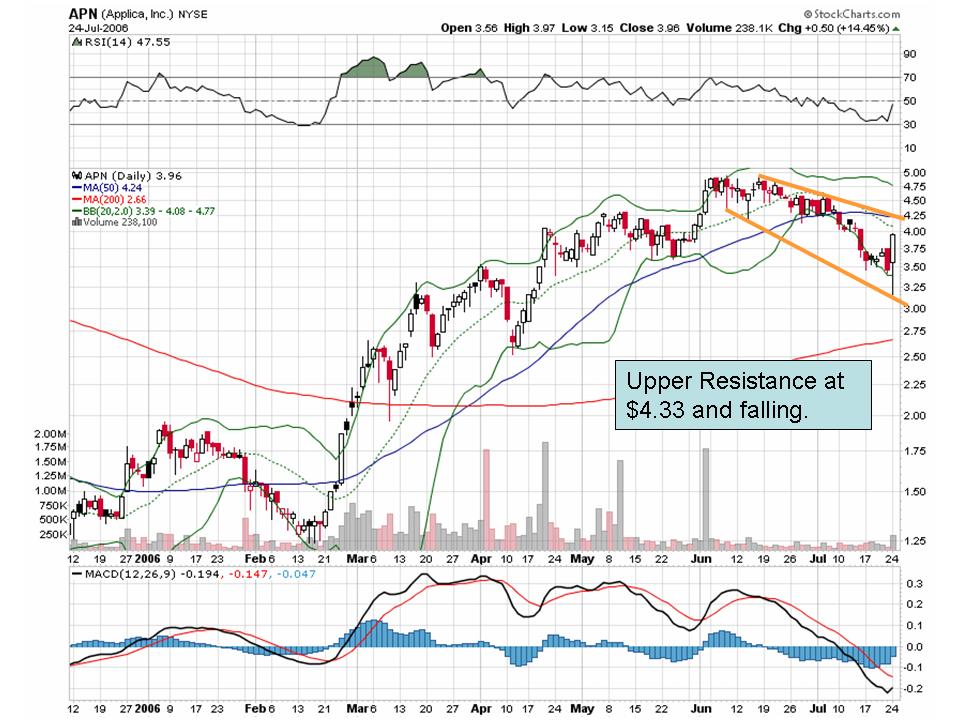
SCON & REY blew out my first upper resistance lines, but have defined new levels that could also work. SCON might go down tomorrow, but REY should be approached with a new tactic, watching the RSI for reversal, and then short.
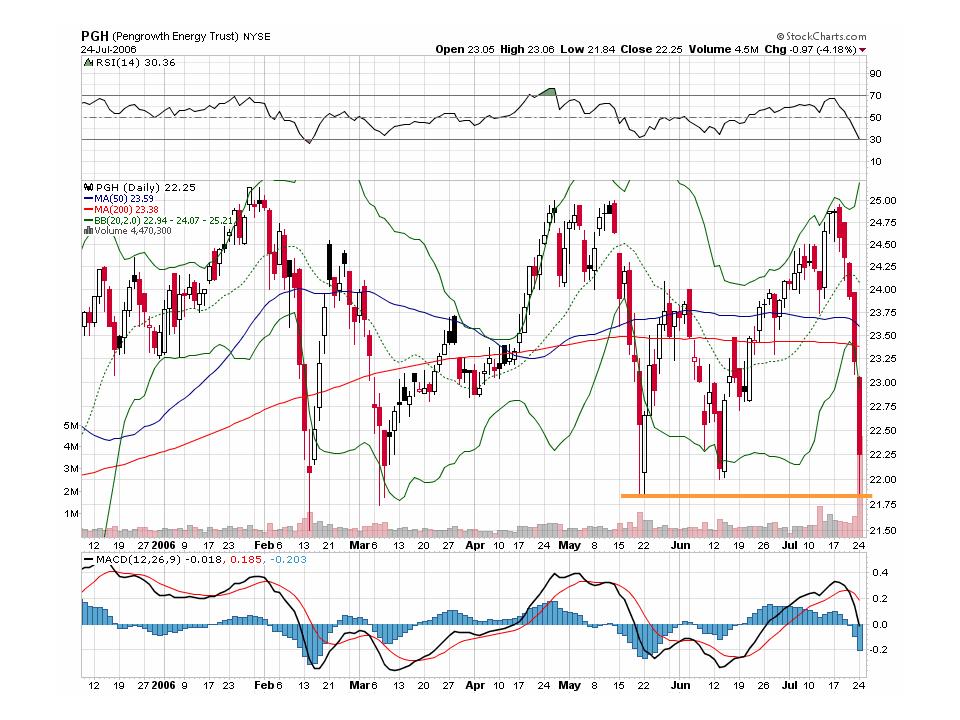
Here's the new market movers:
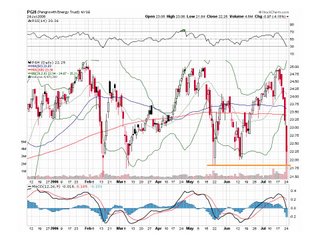
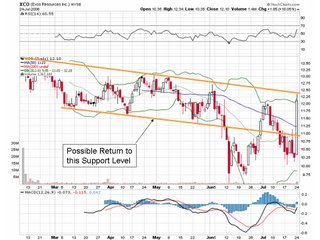
PGH just hit a lower support of $21.85. This should indicate it's time to go long.

Next, is the Gold & Silver Index. I've outlined the normal Head & Shoulders that I see. I suppose it makes sense that it's moving opposite stocks, since Gold is a defence to falling stock prices.

Here's the sum of the stuff from yesterday. ACO & ERTH stayed within bounds, and aren't going anywhere spectacular for tomorrow.

SCON & REY blew out my first upper resistance lines, but have defined new levels that could also work. SCON might go down tomorrow, but REY should be approached with a new tactic, watching the RSI for reversal, and then short.

Here's the new market movers:
PGH just hit a lower support of $21.85. This should indicate it's time to go long.


Sunday, July 23, 2006
Edgy Gets Technical; Stocks to watch for Monday
After reading up some more Technical Analysis (TA), I've attempted to put some line drawing to my charts. My first stop is at my old friend, the S&P 500. I hear some Technicians use two data points to draw their lines, while others use three. I suppose either will work, but three will allow for a greater confidence level. Here's the S&P 500 chart:
I've identified a possible channel, with more recent direction headed down. All these lines indicate that we should see brighter days after another week. Especially when this most recent data looks a bit like an inverted Head & Shoulders patter. The Pennant in the middle of the head might have broken up the pattern, I don't know. But I'll be watching for a breakout in gains if it crosses that sharply decreasing line at the end. Otherwise, it could fall through the support line and down we go.
S&P 500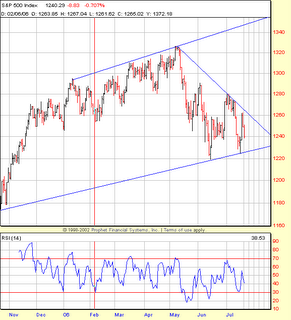
Next is the Gold & Silver Index. This looks like a VERY prominent Head & Shoulders pattern finishing up! If this is true, expect to see the price of gold falling within a week or two.
XAU
Next, I looked at the market movers from Friday. A few caught my eye for charting, and then I weeded a few more out to mention here. First is SCON:
SCON
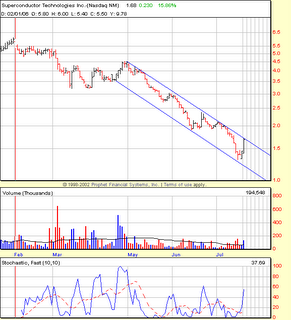
The lower line of the channel seems like a bit of a stretch since I don't feel too confident on the data points that created it. However, there are many data points to provide the upper resistance-line. According to this chart, SCON should not move above about $1.66 on Monday. However, this also looks like another possible inverted Head & Shoulders, albeit stretched out and slanted. If so, and SCON breaks above $1.66 tomorrow, it may be possible that it will keep on trucking up for a while, into a new trading range and/or pattern.
SCON probably has enough momentum to break through the resistance line right now. But the fighting between Israel and Lebanon is still hot & heavy, and now the UN is planning on sending in troops along the border when things settle down. That means more countries will be involved in this battle, and that should shake up the markets on Monday.
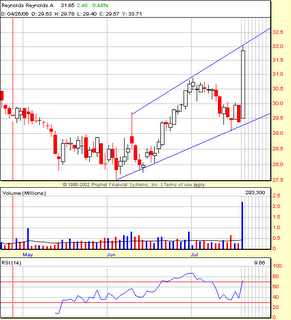
There's also REY. According to this resistance line, REY shouldn't move above about $32.11 Monday. But my experience has shown me that there are typically two more days of reduced-momentum up-days before this stock 'should' peter-out and drop. But with the bad news abroad, who know how people will feel after this weekend? It might just turn right around and go down. However, this stock looks good for the longer term. It's just at its resistance level and needs to cool off for a week or two. I'll be watching it to see how it pans out.
REY
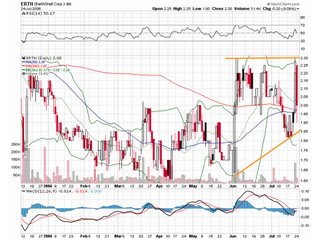
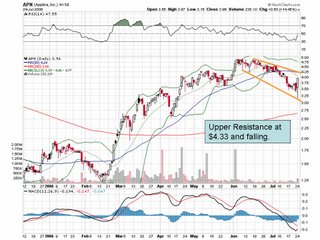
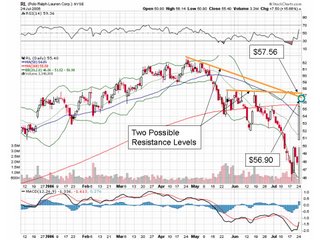
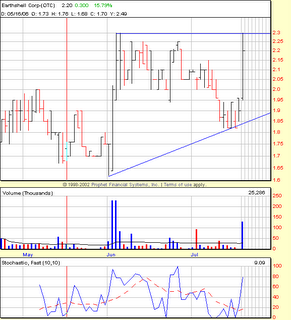
This is ERTH. There is a strong resistance line at $2.30, and another, weaker one at $2.25. The lower support is possibly out of context, but indicates that the price should drop when the triangle closes. I could have also drawn a lower support line starting right AFTER the first jump in price found in the middle of the chart. This would show a widening channel, or a megaphone, which is also a bad sign for the price. My guess is this stock will repeat the behavior of the previous price jump, and bounce its way back down.
ERTH
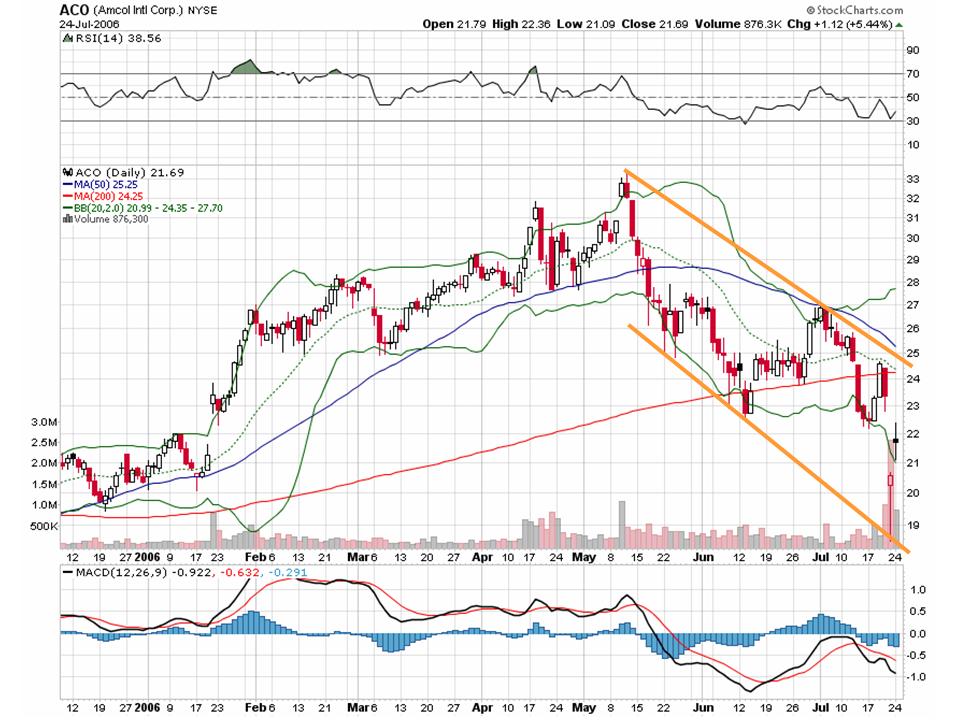
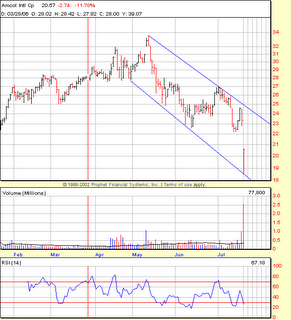
Finally, ACO. This seems to have a strong channel boundary, which indicates the price will most likely go up Monday, and shouldn't drop below $18.38 throughout the day. However, ACO closed pretty close to the channel midrange of a downward trend. This stock has a wide field to travel Monday, so it could really go anywhere. Normally, I might go long this stock after a drop like Friday's, but it may be best to just watch it a few more days to determine where it lies in the channel.
ACO
I'll see about making further charts using StockCharts.com, dressed up with more details on the chart itself. Until next time!
I've identified a possible channel, with more recent direction headed down. All these lines indicate that we should see brighter days after another week. Especially when this most recent data looks a bit like an inverted Head & Shoulders patter. The Pennant in the middle of the head might have broken up the pattern, I don't know. But I'll be watching for a breakout in gains if it crosses that sharply decreasing line at the end. Otherwise, it could fall through the support line and down we go.
S&P 500
Next is the Gold & Silver Index. This looks like a VERY prominent Head & Shoulders pattern finishing up! If this is true, expect to see the price of gold falling within a week or two.
XAU
Next, I looked at the market movers from Friday. A few caught my eye for charting, and then I weeded a few more out to mention here. First is SCON:
SCON
The lower line of the channel seems like a bit of a stretch since I don't feel too confident on the data points that created it. However, there are many data points to provide the upper resistance-line. According to this chart, SCON should not move above about $1.66 on Monday. However, this also looks like another possible inverted Head & Shoulders, albeit stretched out and slanted. If so, and SCON breaks above $1.66 tomorrow, it may be possible that it will keep on trucking up for a while, into a new trading range and/or pattern.
SCON probably has enough momentum to break through the resistance line right now. But the fighting between Israel and Lebanon is still hot & heavy, and now the UN is planning on sending in troops along the border when things settle down. That means more countries will be involved in this battle, and that should shake up the markets on Monday.
There's also REY. According to this resistance line, REY shouldn't move above about $32.11 Monday. But my experience has shown me that there are typically two more days of reduced-momentum up-days before this stock 'should' peter-out and drop. But with the bad news abroad, who know how people will feel after this weekend? It might just turn right around and go down. However, this stock looks good for the longer term. It's just at its resistance level and needs to cool off for a week or two. I'll be watching it to see how it pans out.
REY
This is ERTH. There is a strong resistance line at $2.30, and another, weaker one at $2.25. The lower support is possibly out of context, but indicates that the price should drop when the triangle closes. I could have also drawn a lower support line starting right AFTER the first jump in price found in the middle of the chart. This would show a widening channel, or a megaphone, which is also a bad sign for the price. My guess is this stock will repeat the behavior of the previous price jump, and bounce its way back down.
ERTH
Finally, ACO. This seems to have a strong channel boundary, which indicates the price will most likely go up Monday, and shouldn't drop below $18.38 throughout the day. However, ACO closed pretty close to the channel midrange of a downward trend. This stock has a wide field to travel Monday, so it could really go anywhere. Normally, I might go long this stock after a drop like Friday's, but it may be best to just watch it a few more days to determine where it lies in the channel.
ACO
I'll see about making further charts using StockCharts.com, dressed up with more details on the chart itself. Until next time!
Friday, July 21, 2006
Recession or Lull?
All the gains from the bounce are about gone, and we're back on track to more down-days. Although I hear murmurings of 'recession' now, I wouldn't go that far. I'm just watching the markets and seeing short-term negativity. Of course, I'm only looking short-term.
I suspect that the fighting in Isreal & Lebannon has upstaged the Fed Watch, as Treasuries are finally moving independent of the Fed Rate. I've got some Bonds at 4.9% (darn commisions!), so I say, "bring on the recession fears!". Fear of recession will raise my bond prices so I can eventually sell those and move back into equities. I've begun dabbling in day-trading and learning that I should maybe hold onto my shorts just a tad longer.
Isreal is building troops, and are expected to move into Lebannon this weekend, possibly tonight. At least it will happen while the markets are closed, so that we'll have a day or two for it all to begin before the Wall Street panic ensues. Here's to holding onto my shorts!
Thursday, July 20, 2006
Bounce over already?
I thought today would be a slightly up day instead of the down day it became. We had some up time in the morning, but now we appear to be back on track with the downward spiral the markets have been following. Yesterday's correction was the result of an oversold condition from the previous 3 days. But today's behavior implies that yesterday's correction may have been overdone as well.
Frankly, I think it all points to the common signals these days that investors/traders are very jittery in all markets, countries, and currencies. People aren't letting gains & losses spread too far before they take their money back off the table. I have no idea which way the market might go tomorrow, although I'm suspecting a down day. The indicators that I watch remind me of the instruments on an aircraft panel: they're more accurate when you're cruising. But when you start changing directions, or you're decending slowly in a nose-high attitude (like when you're landing), the instruments get less accurate as the air flow is no longer flowing smoothly into the pitot tube.
Right now, I feel like the market pulled up a little too hard and is going through a bit of a "stall". And the only way to recover from a stall is to get the nose back down...
I'm short across the board: KEA, VOL, LCRD, & MAT. I've been waiting 3 days to short MAT, but it looks like I should have waited only 2 since I couldn't watch it all day. I might drop the VOL in exchange for one or some of the recent movers: AVCI, RIMG (go short), & MOGN (go long).
BERYL: My house is in Florida, my job is in Connecticut. I can't get away from these hurricanes! But I'd rather be here than on the West Coast. Nothing personal, East Coast is just home.
Wednesday, July 19, 2006
Update, Thursday's watch list
BCGI and KEA have reversed their downward trends today with massive gains. Relative Strength for BCGI is reaching its limits, and KEA might have another 3-5 days before it begins to correct.
RSI is only one indicator I'm looking at, but all the indicators point to some loser-stocks getting seriously overbought. Actually, BCGI looks like it's forming one of those 'cup & handle' patterns.
If I can do this right, I might gain back all that money I spent learning about options with UNH.
About charts and TA, Cramer had an excellent quote today for all us chart & TA learners out there:
If an analyst doesn't like a chart, he'll just draw a different line and explain it all over again.
Ha! Ha! I knew I kept watching that show for SOME reason!
Bounce with me!
I feel almost evil being so Bearish against the markets still. However, I shorted Radio Shack and Volt yesterday despite mediocre signals. I even saw that today might be an up-day, although I didn't expect this much! Now, my shorts are hurting, but I'm still optimistic that they'll drop back into the money next week. My one Long spot, Alliance Imaging, helped ease the pain, and I might jump back into that short spot against Forest Labs. Now, what have I learned from all this? I saw the up-day coming, I should have covered my shorts FIRST. Ok, ok, next time, promise!
I'm expecting tomorrow should be a good day to short Mattel. I was also expecting to see a rebound from 3M, but they are really starting to scare me. I've also given up on United HealthCare until they find a direction and stick with it.
Today's gains relieved the excessive selling from the past few days, but I see that I'm definitely not the first person to say that this evening. The long term sentiment still expects things to go down, so this bounce might be done by next week. We'll see!
Anyone know where oil is really going? I just heard a rumor today that oil distribution companies are expecting lower prices soon, while the talking heads say to look for $100 a barrel before the New Year. I know, I know, don't listen to the talking heads, but I gotta have SOME noise in the background.
Tuesday, July 18, 2006
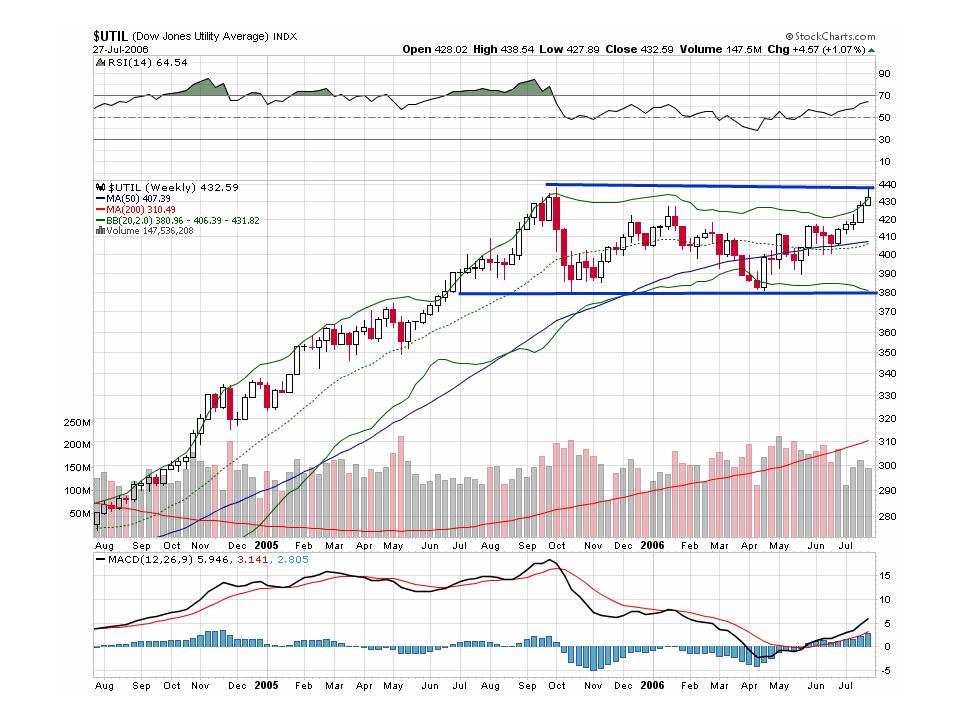
Utilities, the defensive play
Today the S&P 500's 50-day moving average crossed below the 200-day, albeit 2 months since the index began falling.
Some signs point to a short-term bottom, as the markets bounce after some hard-hitting days. Across the board, everything has been down: Oil, Gold, Stocks, Bonds, and other commodities. Everything, that is, except the Utilities, who's technicals look inverted to everything else (it's moving opposite, like a defensive sector).
I finally found it after looking overseas to figure out where the money's going. If everything in the U.S. is going down, is it all just going to cash (which MANY people say they are doing)? Despite the Israeli tensions, the Middle Eastern markets were way up today, and India had a good day despite yesterday's train bombing in the financial zone. My guess is people are buying into the panic of these countries, expecting things to get better eventually.
However, fighting and bombing are still going on, and I fear there is more blood to be shed "in the streets." I'd say these investors/traders are jumping the gun (no pun intended), or catching a falling knife. Those markets may likely see more losses in the near future.
Back to the U.S., I expect we'll see a short-term bounce (or "rally" as the media likes to say). But I'm still Bearish overall until I see better signs.
And where's the talk on today's Homebuilder Index release???
Monday, July 17, 2006
Finally off Vacation
Ok, it's been several weeks since my last post. I'm sure all three of you have been anxiously waiting for the next tidbit of vital information that will help us all make more money in the markets. R-i-i-i-i-i-i-g-h-t.
Here's a question: With the current fighting in Isreal and Lebanon, and Isreal refuting rumors that it will end fighting soon, why is the price of oil going down amidst this Middle Eastern open fighting?
Possible answer: I heard a trader on Bloomberg radio today saying that it was discovered that during the turmoil and Mid-East oil crisis of the 1970's, oil production in the Middle East continued and oil reserves actually reached record highs. Therefore, there really never was an oil crisis during the 1970's, only speculative hype that put Orwell's 'War of the Worlds' to shame. Meanwhile, weren't we just talking about oil reserves reaching an 8-year high just last month?
Over the weekend, I heard an excellent quote. I wish I knew the name of the man who said it:
"Ethanol is today's Internet Bubble."
By the way, everywhere on TV (except my 2 favorite channels, CNBC and Cartoon Network, which is why they're my favorite) have nothing but the Israel/Lebanon fighting all day & night. I made the mistake of tuning to CNN and can't peel away from the riveting drama of reporters running from falling rockets that stalled on launch. But through all this, did anyone notice that Avril Lavigne got married today? Sheesh! What's happened to news these days???
Subscribe to:
Posts (Atom)