So, 4 years since my last post and they haven't deleted me yet. Hmmm, I'll have to start making it worth their while. Got some new systems put together that I'd like to try out, and maybe I'll show off a few things for the scan-bots that read this site.
Off to NYC for the week, though. So nothing until later. Cheers!
Monday, March 21, 2016
Tuesday, June 26, 2012
General Update, 2012/06/26
The general trend is still DOWN for long-term indices. IWM is playing out a small rising wedge, which may bottom around 75.00. After that, I'll be watching to see if this is the rounding point for the final, election time rampup before the next great pop.
Still holding TZA, looking for a 72.00 IWM exit point unless we recover sooner.
Friday, June 08, 2012
Friday, May 25, 2012
Coming back
I'm thinking of coming back to blogger for various reasons. This is a trial post from my new mobile device, and I wonder how I'll get charts on here now.
Tuesday, March 29, 2011
Time For Change
I'm going to start posting at SharePlanner.com. They already have membership and a good forum started, so I expect to get more feedback from my posts. You can find me listed as, "Edgy".
Sunday, February 13, 2011
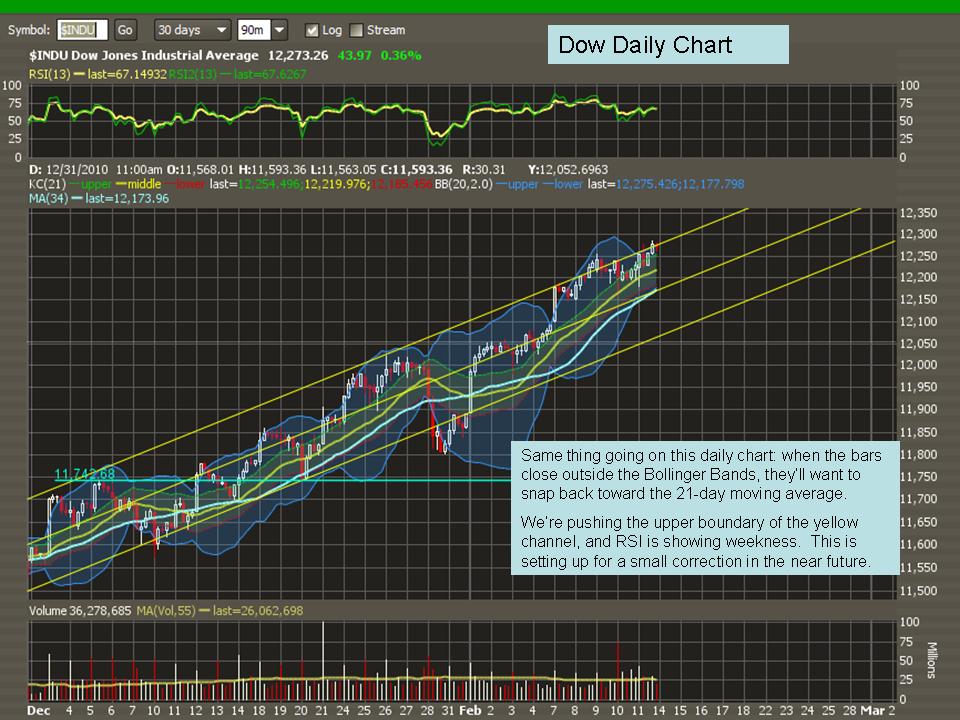
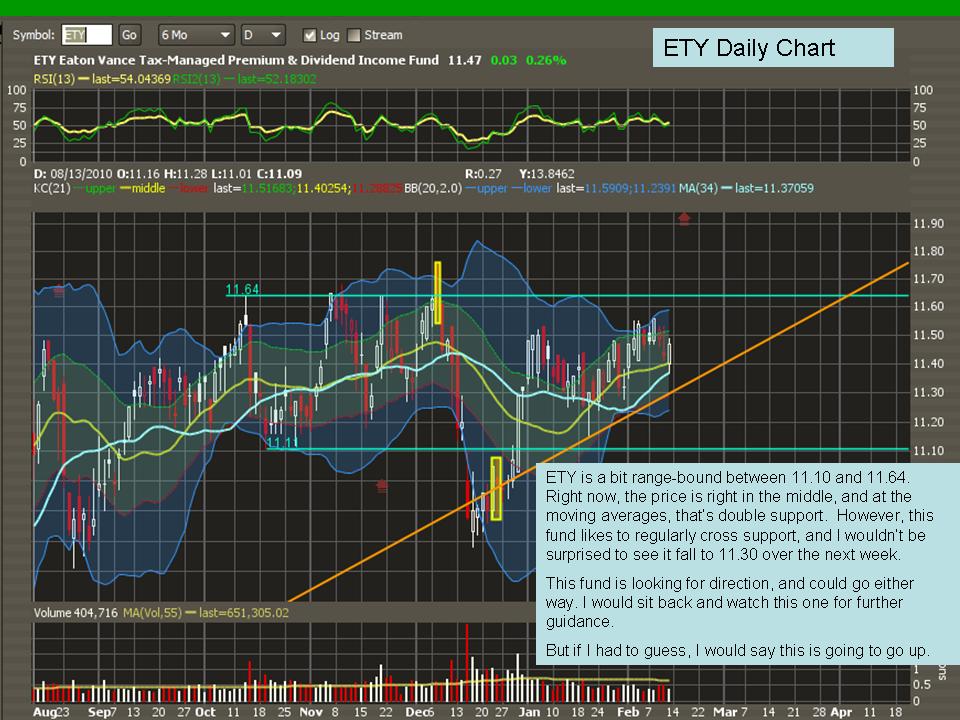
Weekly Technical Analysis
I've been looking at some mutual funds for a buddy at work. I figured I might as well post them for the sake of keeping up with this blog.
In short, this week looks like it's setting up to be flat or down for the big Indices. But the POMO has proven me wrong over and over again.


Wednesday, December 15, 2010
Wass Happenin?


I'm already stopped-out of ANH, and just got in NTRZ.
KKD is looking good, and the indices already did a headfake this morning.
Here's to an even lower-volume Christmas rally!!!
Subscribe to:
Posts (Atom)