Now, from my limited experience, I've seen breakouts from triangle patterns usually happen before the point is reached. I pulled up a chart of the S&P 500 to get a guess of where it might be in Q1-Q2 of 2007. It's currently riding a channel up, and could be anywhere between 1300 and 1380 if it stays in that channel.
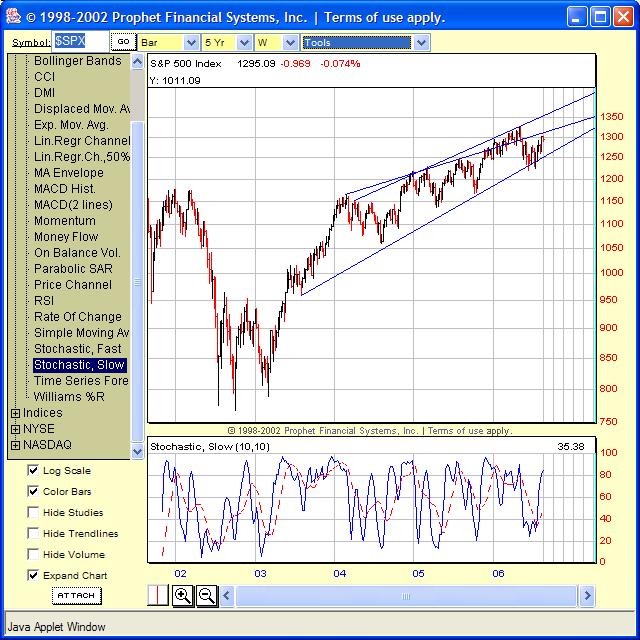
That diagonal line cutting the channel was where I noticed some consolidation on the resistance side. The line follows the upper level from March of 2004 through today, with the exception of the breakout and resistance from Nov 2004 through May 2005. I left that in to note some interesting behavior how that line seems relevant. But this it technical analysis, so it might not mean anything beyond this point. The Stochastics show signs of peaking already, but the momentum and RSI still have room to grow (not shown).
I'm concerned about the weakening Stochastics. I'm dropping my shorts (pun intended) and starting to find myself in more long positions. But I'm afraid this may be too much of running with the Bulls, and the Bears will sneak out from the trees and take us by surprise.
The XAU is nearing resistance, and gold itself is showing weakness at the end of its own symmetrical triangle.

Hmmm....
No comments:
Post a Comment