First, I looked at a weekly chart of a stock to search for targets, then a daily chart. Using Stockcharts.com, I keep their format of RSI on top, MACD below, but place a Force Index below that, and use three exponential moving averages (EMA) in the main chart. Here's three stocks below:
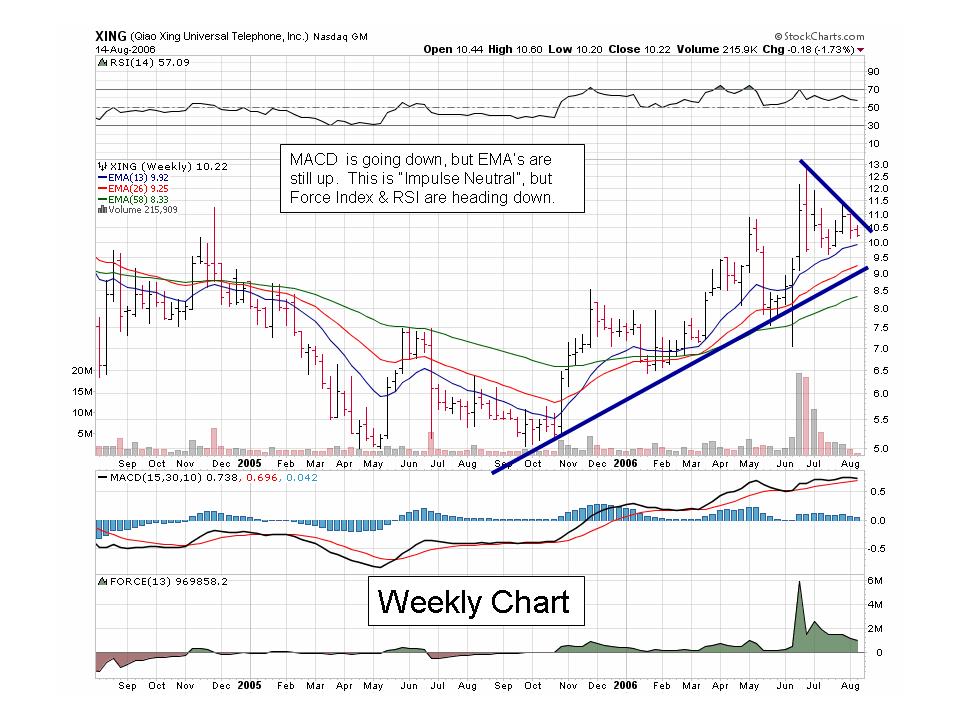
XING looks like it's getting ready to drop. The weekly chart above has a few indicators pointing toward a long-term drop. So I check the daily chart for recent trends.

The daily chart looks like it confirms the long-term trend. I plan to short it tomorrow.
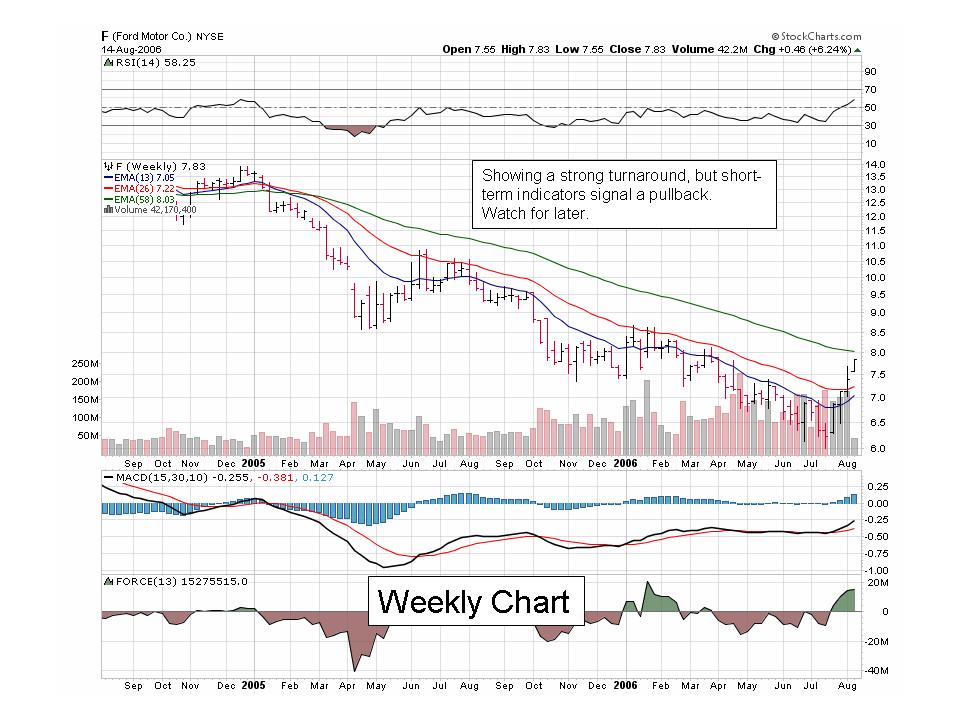
I heard last week that Ford just hired a new executive who is experienced in M&A (mergers & acquisitions). With all this talk about how Mr. William C. Ford Jr. should maybe look into taking the company private, this seems like a very smart move. So, I decided to check them out as a turnaround target. The weekly chart above shows that a turnaround is, indeed, in progress. But, I'm afraid it's already long in the tooth, and I might wait for a minor correction to go long.

The daily chart shows the stock is still pretty strong. Only the RSI is getting into the "red zone" of the stock being overbought. All the other indicators show that this stock is going places, but I'll wait for a pullback before getting in. I just hope a pullback will be worth waiting!
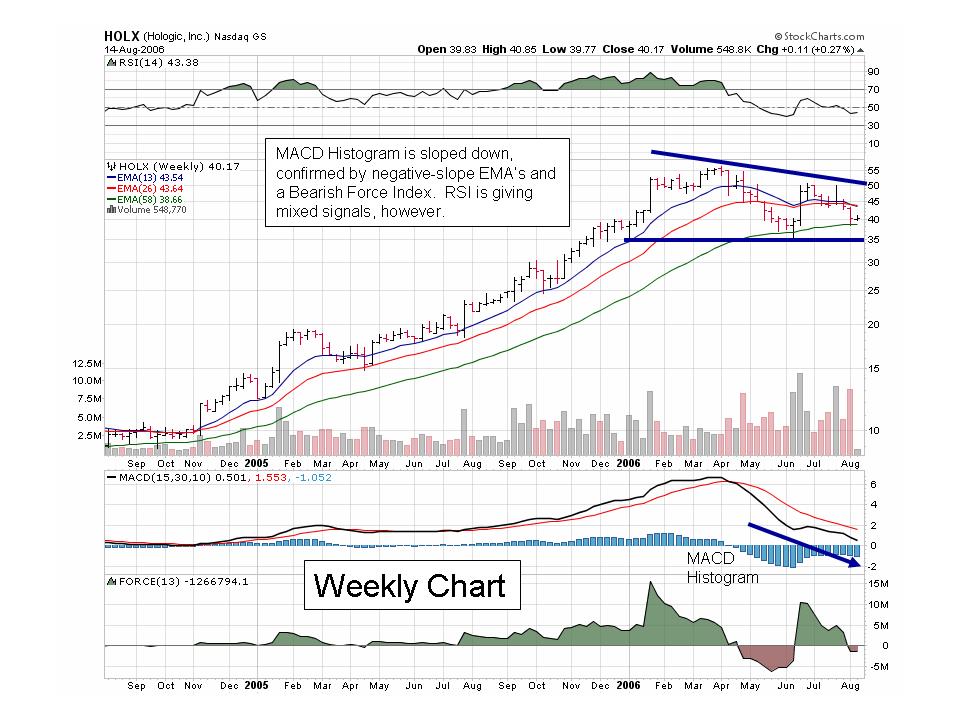
This is a stock that I did for a friend, just to see what it looks like. And it doesn't look pretty. This stock looks like it's just going sideways after a nice runup, and I can't really tell after that. The primary MACD Histogram and EMA slopes are telling me to short, but the RSI is giving a mixed message. Perhaps I'm giving too much credit to RSI?
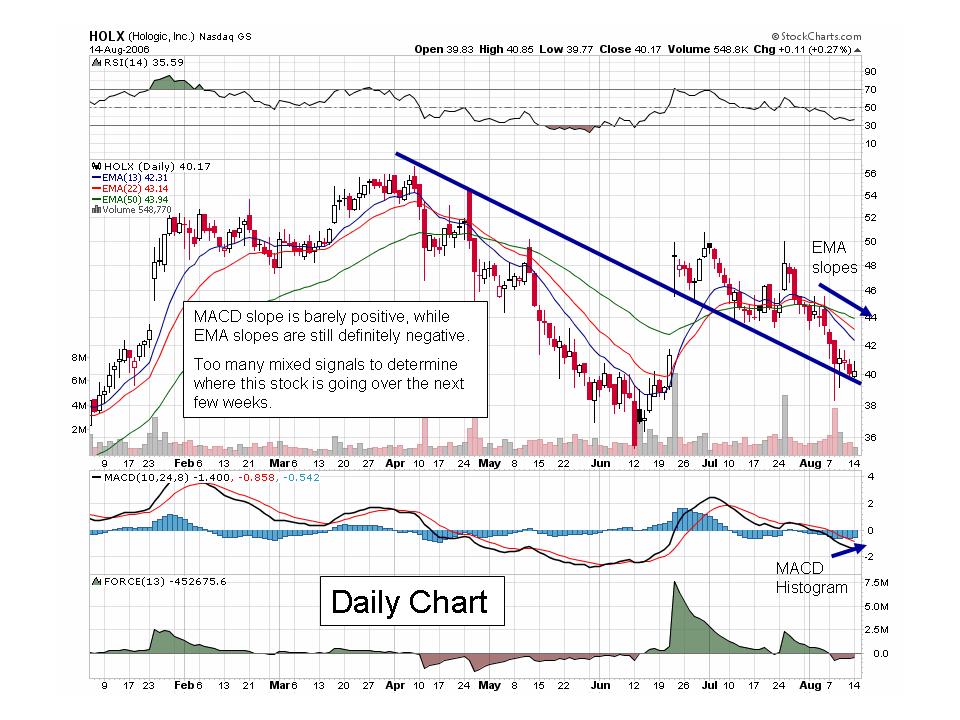
3 out of 5 indicators are telling me to short, and that's just not confident enough for me to make a solid decision. RSI and MACD histogram slope are going up, but this is short-term, and I'm really not too attached to the trendline that I have drawn. If I had to guess, I'd say HOLX will go up for a brief rally, then come back down in toward my support line.
No comments:
Post a Comment