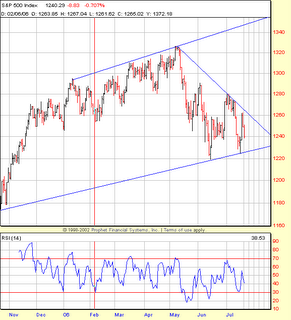
I've identified a possible channel, with more recent direction headed down. All these lines indicate that we should see brighter days after another week. Especially when this most recent data looks a bit like an inverted Head & Shoulders patter. The Pennant in the middle of the head might have broken up the pattern, I don't know. But I'll be watching for a breakout in gains if it crosses that sharply decreasing line at the end. Otherwise, it could fall through the support line and down we go.
S&P 500

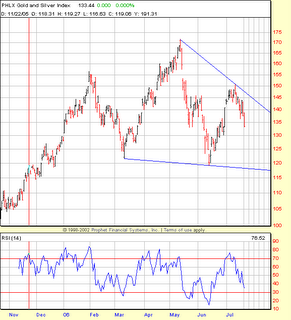
Next is the Gold & Silver Index. This looks like a VERY prominent Head & Shoulders pattern finishing up! If this is true, expect to see the price of gold falling within a week or two.
XAU

Next, I looked at the market movers from Friday. A few caught my eye for charting, and then I weeded a few more out to mention here. First is SCON:
SCON

The lower line of the channel seems like a bit of a stretch since I don't feel too confident on the data points that created it. However, there are many data points to provide the upper resistance-line. According to this chart, SCON should not move above about $1.66 on Monday. However, this also looks like another possible inverted Head & Shoulders, albeit stretched out and slanted. If so, and SCON breaks above $1.66 tomorrow, it may be possible that it will keep on trucking up for a while, into a new trading range and/or pattern.
SCON probably has enough momentum to break through the resistance line right now. But the fighting between Israel and Lebanon is still hot & heavy, and now the UN is planning on sending in troops along the border when things settle down. That means more countries will be involved in this battle, and that should shake up the markets on Monday.
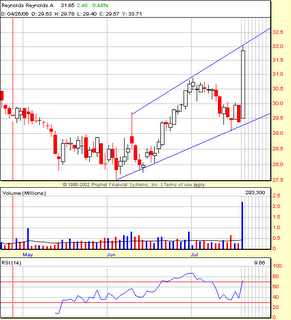
There's also REY. According to this resistance line, REY shouldn't move above about $32.11 Monday. But my experience has shown me that there are typically two more days of reduced-momentum up-days before this stock 'should' peter-out and drop. But with the bad news abroad, who know how people will feel after this weekend? It might just turn right around and go down. However, this stock looks good for the longer term. It's just at its resistance level and needs to cool off for a week or two. I'll be watching it to see how it pans out.
REY

This is ERTH. There is a strong resistance line at $2.30, and another, weaker one at $2.25. The lower support is possibly out of context, but indicates that the price should drop when the triangle closes. I could have also drawn a lower support line starting right AFTER the first jump in price found in the middle of the chart. This would show a widening channel, or a megaphone, which is also a bad sign for the price. My guess is this stock will repeat the behavior of the previous price jump, and bounce its way back down.
ERTH

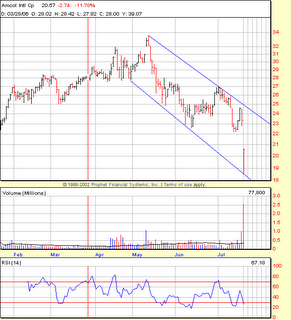
Finally, ACO. This seems to have a strong channel boundary, which indicates the price will most likely go up Monday, and shouldn't drop below $18.38 throughout the day. However, ACO closed pretty close to the channel midrange of a downward trend. This stock has a wide field to travel Monday, so it could really go anywhere. Normally, I might go long this stock after a drop like Friday's, but it may be best to just watch it a few more days to determine where it lies in the channel.
ACO

I'll see about making further charts using StockCharts.com, dressed up with more details on the chart itself. Until next time!
No comments:
Post a Comment