I've been starting with the weekly charts to find patterns, since my schedule prevents me from trading more frequently than daily. I've stuck my toe in the water with the following four tickers, and the charts are shown daily for a little more clarity.
UUP

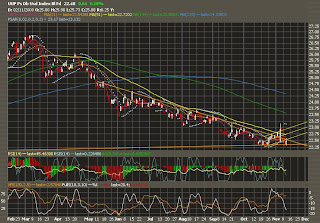
Boy, looks like I'm bucking the trend on this one. But I've thrown a little fundamental assumptions into this, since it's a Dollar Index follower. I jumped-in following the break in trend on good volume last week. I later found through ZeroHedge that the big spike might have been limited insider trading, and not actual capitulation. Notice that UDN didn't move in tandem, and only UUP was announcing more share issues.
Nevertheless, UUP is still fighting support at this time. There is one heck of a lot of noise on which way the Dollar is going to go from here, and most of it is bearish. So, I have my doubts, but I'm trying to make a point of ignoring the noise more and more, and just watching the charts. For now, I'm holding out and ready to pull the plug. One thing that gives me hope is that yesterday's candle sure looks suspiciously like a stop-sweep...which are often followed by swift moves in the opposite direction. But I've only found those intraday before.
KKD

I was so excited when Krispy Kreme went IPO about 10 years ago... it was around $18 and I wasn't even trading stocks yet then. It closed at $3.39 today and hasn't ever split. I remember thinking about how a share was only a dollar back in March, and wondering how many shares I could get for the price of a dozen "hot doughnuts now."
This chart shows a nice and steady uptrend that might also be a rising wedge. As long as this trend holds I'll keep confident all the way up to 4.38... where I'll keep holding through the 4th attempt to break support. From the first test on resistance, this chart actually looks like a cup and saucer formation brewing.
HW

Headwaters, I don't even know what they do. But this chart shows another rising wedge squeezed near the end, looking to break out. It appears that I may have jumped in a bit early, as there's more downside risk in this narrow range at the tip of the wedge. It also might be a failed pattern since resistance was broken for several days in October, but then failed to become support. This stock may be entering a new trend, but I've put my money in that this could be a bull-flag and the main trend will continue. There's low tolerance if this trend gets broken, however.
GSX

I bought Gasco thinking we might have a Holy Grail pattern off the 51 MA, and that's when I got in. Unfortunately, the 51 MA has been broken and I have to count on the upward trend holding out. This is a penny stock, so moves either way could be severe. Keep the safeties off.
No comments:
Post a Comment