As I peruse throught the various stocks and indices out there, I notice that volume has been gradually decreasing for months and more. It's like more people are either sitting on their bets, pulling out of the markets, or just aren't sure where to go (uncertainty). Sure, a few stocks here and there are moving around, but I sure am noticing a lot of volume trailing away. I suppose whenever the market decides to get moving, it's really gonna move!
Perhaps when the reality of housing hits, ARMs convert, foreclosures go up, cats & dogs start living together, we'll see renewed interest in stocks? Or more running for cover?
Speaking of housing, there's this great comment I read off of my favorite (other) blog, The Big Picture:
"...To complete the global picture, consider this - in one of the condo buildings I surveyed in Pune (near Bombay), the builder told me that 50% of the condos were sold to US investors who used, wait for it, HELOCs in their US properties to buy property in India."
And I thought the lottery was the only tax on stupidity!
Friday, September 15, 2006

Thursday, September 14, 2006
Bond-O
My last post addressed how the news and gossip that I read sound very upbeat and positive about the markets. This is a good sign that the smart money might be ready to take some profits. Correct me if I'm wrong, but this rally/correction to the bear-correction may soon be ready for its own correction.
Some say that the bond market contains the 'adults' of the markets, and bond prices are rising. Isn't that a sign that we might be in for some more bad days in stocks? There are all the reasons, FED Watch, Oil prices, housing, etc.. but the fact remains that bonds are rising.
Even this morning, the local Orlando news had a story of realtors admitting that the soft landing is going to be harder than previously thought. They expect the slump in sales to bottom next summer. But they were wrong about the landing (or just didn't want to admit it), so I take their word with a pinch of salt.
Some say that the bond market contains the 'adults' of the markets, and bond prices are rising. Isn't that a sign that we might be in for some more bad days in stocks? There are all the reasons, FED Watch, Oil prices, housing, etc.. but the fact remains that bonds are rising.
Even this morning, the local Orlando news had a story of realtors admitting that the soft landing is going to be harder than previously thought. They expect the slump in sales to bottom next summer. But they were wrong about the landing (or just didn't want to admit it), so I take their word with a pinch of salt.
Wednesday, September 13, 2006
Been Off Track
It's been a while since my last post. My excuse is that I haven't had much to say the past few days. I've been busy with work and family, and really haven't been able to keep up on the markets.
This has cost me in my trading as well as my blogging. I've been hammered the past few days, losing gains while not keeping on top of them. Tonight I begin to scan the indices, news, and other blogs that I watch for updates and find out what I've missed. Gold has fallen, oil is down, and the markets have been rallying in concert.
It's been 3 days now for the Nasdaq to rally, and it's showing signs of weekness. Since I've been hurt shorting so many times, I hesitate to short now. I was hoping to become more bullish, probably because of this uptrend that we've been in for a few weeks now. Meanwhile, the prophecies of another major correction in October still linger, with a few mentioning it. Now WOULD be a good time for another correction, because no one expects it.
There are several reasons that things are up this week, Options expiring Friday, oil down, consumer confidence rising, VIX down, optimistic FED expectations, and the smart money is pounding the Bears. I expect to see some profit-taking on Friday as the rest of us newbies decide to go long.
As for myself, I'm going take a good, long look at the big picture before I jump back in.
This has cost me in my trading as well as my blogging. I've been hammered the past few days, losing gains while not keeping on top of them. Tonight I begin to scan the indices, news, and other blogs that I watch for updates and find out what I've missed. Gold has fallen, oil is down, and the markets have been rallying in concert.
It's been 3 days now for the Nasdaq to rally, and it's showing signs of weekness. Since I've been hurt shorting so many times, I hesitate to short now. I was hoping to become more bullish, probably because of this uptrend that we've been in for a few weeks now. Meanwhile, the prophecies of another major correction in October still linger, with a few mentioning it. Now WOULD be a good time for another correction, because no one expects it.
There are several reasons that things are up this week, Options expiring Friday, oil down, consumer confidence rising, VIX down, optimistic FED expectations, and the smart money is pounding the Bears. I expect to see some profit-taking on Friday as the rest of us newbies decide to go long.
As for myself, I'm going take a good, long look at the big picture before I jump back in.
Wednesday, September 06, 2006
Long Weekend
Well, the 'adults' are back in the markets, as CNBC put it yesterday. And trading is supposedly back to serious trading, as everything closed way up on Monday.
It's good to see an up-day, but I feel that the recent end-of-summer rally is a bit overbought. In particular, I noticed Ford's chart was showing a weeker slope with possible signs of a turnaround. I shorted yesterday, right before Bill's announcement of his new CEO. The stock is up on the overnight news, but I'm not ready to give up yet. The stop is set, and I expect the price to recover down to the low of a channel, maybe to 7.80, before recovery.
Basically, the good news had already been 'baked in' to Ford's stock. I wanted to go long when I first heard Ford had hired a well-known turnaround manager, but the stock had already rallied. But I watched it rise another 2 bucks while waiting for the rocket fuel to burn out. I don't expect to be short more than a week, as I have good faith in the new CEO. However, it will be a long and slow recovery.
Here's a random question:
Why is it that the really cool/funny commercials these days are by the credit card companies? Namely, the Capital One commercials, and the Citi Identity Theft victims are my favorites today. Until about 5 years ago, the beer commercials were the best. What happened? Did those talented marketers move to companies that serve the credit card companies? Or is this a sign of the times, that money is no longer in beer, but in the financial industry?
It's good to see an up-day, but I feel that the recent end-of-summer rally is a bit overbought. In particular, I noticed Ford's chart was showing a weeker slope with possible signs of a turnaround. I shorted yesterday, right before Bill's announcement of his new CEO. The stock is up on the overnight news, but I'm not ready to give up yet. The stop is set, and I expect the price to recover down to the low of a channel, maybe to 7.80, before recovery.
Basically, the good news had already been 'baked in' to Ford's stock. I wanted to go long when I first heard Ford had hired a well-known turnaround manager, but the stock had already rallied. But I watched it rise another 2 bucks while waiting for the rocket fuel to burn out. I don't expect to be short more than a week, as I have good faith in the new CEO. However, it will be a long and slow recovery.
Here's a random question:
Why is it that the really cool/funny commercials these days are by the credit card companies? Namely, the Capital One commercials, and the Citi Identity Theft victims are my favorites today. Until about 5 years ago, the beer commercials were the best. What happened? Did those talented marketers move to companies that serve the credit card companies? Or is this a sign of the times, that money is no longer in beer, but in the financial industry?
Tuesday, August 29, 2006
It's KATRINA all over again!!! Shut down the State of Florida!!!!
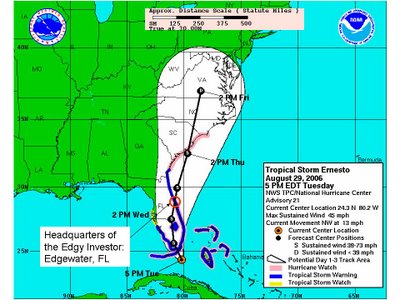
Tropical Storm Ernesto didn't gather enough strength in the waters between Cuba and Miami to attain hurricane strength. Still, a large storm is about to roll over the state and officials have decided to shut it down. The image below states that max sustained winds will be 45 mph, while the evening news is all over Central Florida (where I live) covering those who are stocking up on ice and putting up hurricane shutters.
I shouldn't be too surprised at this irrational exuberance, given today is around the anniversary of Katrina in New Orleans, 500 miles away. I can understand the officials being 'better safe than sorry', but hurricanes and tropical storms lose strength over land. Ernesto will hit Miami rather hard, but not at hurricane strength. It will cruise its way up through the middle of Florida, losing strength the whole time.
I say Orlando and Daytona are over-reacting, closing schools so that the school buses don't have to drive in 'high winds'. We will get rain up here, lots of it dumped down, but not the high winds.
I'll be home with the kids, checking the markets and reading books. Cheers!
I shouldn't be too surprised at this irrational exuberance, given today is around the anniversary of Katrina in New Orleans, 500 miles away. I can understand the officials being 'better safe than sorry', but hurricanes and tropical storms lose strength over land. Ernesto will hit Miami rather hard, but not at hurricane strength. It will cruise its way up through the middle of Florida, losing strength the whole time.
I say Orlando and Daytona are over-reacting, closing schools so that the school buses don't have to drive in 'high winds'. We will get rain up here, lots of it dumped down, but not the high winds.
I'll be home with the kids, checking the markets and reading books. Cheers!

Sunday, August 27, 2006
Running Scared
As I plow through a list of stocks to find opportunities, I couldn't help but notice that many companies (listed under $10) are forming symmetrical triangle patterns. Even more interesting, is that the points of these triangles should appear around Q2 of 2007.
Now, from my limited experience, I've seen breakouts from triangle patterns usually happen before the point is reached. I pulled up a chart of the S&P 500 to get a guess of where it might be in Q1-Q2 of 2007. It's currently riding a channel up, and could be anywhere between 1300 and 1380 if it stays in that channel.
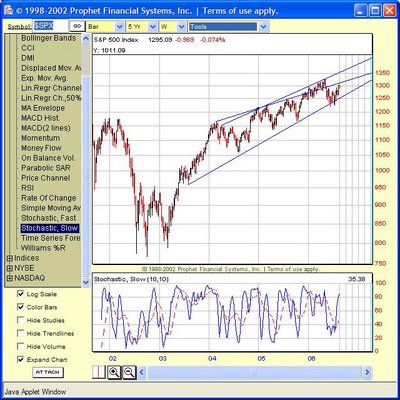
That diagonal line cutting the channel was where I noticed some consolidation on the resistance side. The line follows the upper level from March of 2004 through today, with the exception of the breakout and resistance from Nov 2004 through May 2005. I left that in to note some interesting behavior how that line seems relevant. But this it technical analysis, so it might not mean anything beyond this point. The Stochastics show signs of peaking already, but the momentum and RSI still have room to grow (not shown).
I'm concerned about the weakening Stochastics. I'm dropping my shorts (pun intended) and starting to find myself in more long positions. But I'm afraid this may be too much of running with the Bulls, and the Bears will sneak out from the trees and take us by surprise.
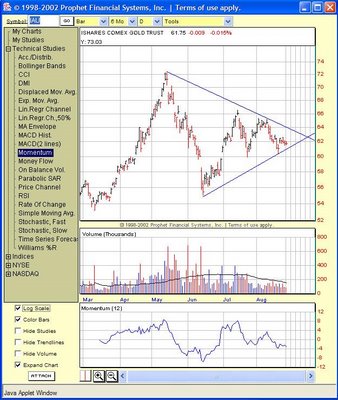
The XAU is nearing resistance, and gold itself is showing weakness at the end of its own symmetrical triangle.
Hmmm....
Now, from my limited experience, I've seen breakouts from triangle patterns usually happen before the point is reached. I pulled up a chart of the S&P 500 to get a guess of where it might be in Q1-Q2 of 2007. It's currently riding a channel up, and could be anywhere between 1300 and 1380 if it stays in that channel.
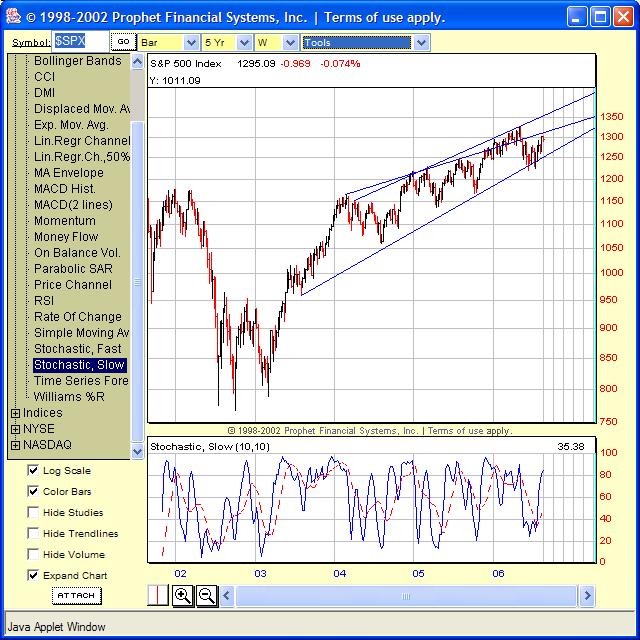
That diagonal line cutting the channel was where I noticed some consolidation on the resistance side. The line follows the upper level from March of 2004 through today, with the exception of the breakout and resistance from Nov 2004 through May 2005. I left that in to note some interesting behavior how that line seems relevant. But this it technical analysis, so it might not mean anything beyond this point. The Stochastics show signs of peaking already, but the momentum and RSI still have room to grow (not shown).
I'm concerned about the weakening Stochastics. I'm dropping my shorts (pun intended) and starting to find myself in more long positions. But I'm afraid this may be too much of running with the Bulls, and the Bears will sneak out from the trees and take us by surprise.
The XAU is nearing resistance, and gold itself is showing weakness at the end of its own symmetrical triangle.

Hmmm....
Monday, August 21, 2006
Just When I Thought Gas was Getting Better
It's a conspiracy, I tell ya! These oil barons in South America and the Middle East are creating "news" because it keeps oil prices up. The political wing-nuts can say what they will about conflicts, but oil traders are buying up oil futures on any dip. Oil briefly dropped below $70 a barrel Friday, but it didn't last very long. Here's the article:
"VIENNA, Austria (AP) -- Oil prices rose back near $72 a barrel Monday, rebounding from declines the week before, after Iran insisted that it will not suspend uranium enrichment.
Prices also appeared underpinned by concerns about supply disruptions in Nigeria due to civil unrest and fear of potential hurricanes that could strike Gulf of Mexico refineries. Traders were also watching for signals of where fuel demand is headed in the wake of BP's production woes at its Prudhoe Bay field in Alaska...
Speaking after Iran's military test-fired 10 short-range missiles, Foreign Ministry spokesman Hamid Reza Asefi said a nuclear compromise would have to be reached during future negotiations.
"Everything has to come out of negotiations," Asefi said. "Suspension is not on our agenda."
The U.N. Security Council passed a resolution last month calling for Iran to suspend uranium enrichment by Aug. 31 or face the threat of economic and diplomatic sanctions.
"It is very difficult to decide what to do now in this situation," said Koichi Murakami, an analyst with brokerage Daiichi Shohin in Tokyo..."
Enough said.
"VIENNA, Austria (AP) -- Oil prices rose back near $72 a barrel Monday, rebounding from declines the week before, after Iran insisted that it will not suspend uranium enrichment.
Prices also appeared underpinned by concerns about supply disruptions in Nigeria due to civil unrest and fear of potential hurricanes that could strike Gulf of Mexico refineries. Traders were also watching for signals of where fuel demand is headed in the wake of BP's production woes at its Prudhoe Bay field in Alaska...
Speaking after Iran's military test-fired 10 short-range missiles, Foreign Ministry spokesman Hamid Reza Asefi said a nuclear compromise would have to be reached during future negotiations.
"Everything has to come out of negotiations," Asefi said. "Suspension is not on our agenda."
The U.N. Security Council passed a resolution last month calling for Iran to suspend uranium enrichment by Aug. 31 or face the threat of economic and diplomatic sanctions.
"It is very difficult to decide what to do now in this situation," said Koichi Murakami, an analyst with brokerage Daiichi Shohin in Tokyo..."
Enough said.
Wednesday, August 16, 2006
Trampled by the Bulls
Ok, perhaps it's time to finally stop being bearish about the markets. I'm getting run over as I scramble to cover my shorts. The play on XING ripped me a new one today, but I've got a stop set at the last high of $11.57. Too late, I realize I should have set a stop at the new rule of 2%, based on Dr. Alexander Elder's rule for risk control.
While trying to figure out which way it's gonna go tomorrow, I've got a few long candidates, and even a couple of new shorts to watch. This rally is really burning energy at a breakneck pace, so I'm curious what kind of breather it'll take. The build was so strong today that I suspect the S&P 500 will definitely be up again tomorrow. The price and volume look kinda like last year, March 13-20, which went a slightly down, flat, and recovered again. Is the end in sight?
No one ever said anything about the 'blood in the streets' to explain this rally. And where are those people who think we'll have another big drop in the next month or two? Heck, I predicted this rebound was emminent, but I'm still not quick enough to actually recognize it in time. But, yesterday marked the first day I begin printing the charts of my trades upon entry and exit along with notes. Here's to finally showing some improvement!
Think Thursday will be an upday or not?
While trying to figure out which way it's gonna go tomorrow, I've got a few long candidates, and even a couple of new shorts to watch. This rally is really burning energy at a breakneck pace, so I'm curious what kind of breather it'll take. The build was so strong today that I suspect the S&P 500 will definitely be up again tomorrow. The price and volume look kinda like last year, March 13-20, which went a slightly down, flat, and recovered again. Is the end in sight?
No one ever said anything about the 'blood in the streets' to explain this rally. And where are those people who think we'll have another big drop in the next month or two? Heck, I predicted this rebound was emminent, but I'm still not quick enough to actually recognize it in time. But, yesterday marked the first day I begin printing the charts of my trades upon entry and exit along with notes. Here's to finally showing some improvement!
Think Thursday will be an upday or not?
Monday, August 14, 2006
And Now for Something not-so-Completely Different.
Ok, here's something new. Based on what I've read so far from Entries & Exits, I'm experimenting with using some of the charting techniques laid out by Dr. Elder.
First, I looked at a weekly chart of a stock to search for targets, then a daily chart. Using Stockcharts.com, I keep their format of RSI on top, MACD below, but place a Force Index below that, and use three exponential moving averages (EMA) in the main chart. Here's three stocks below:
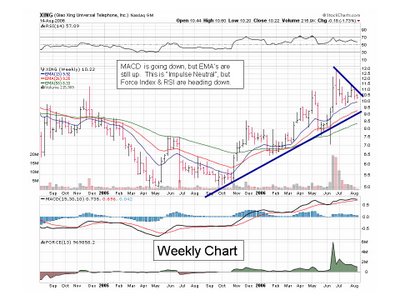
XING looks like it's getting ready to drop. The weekly chart above has a few indicators pointing toward a long-term drop. So I check the daily chart for recent trends.
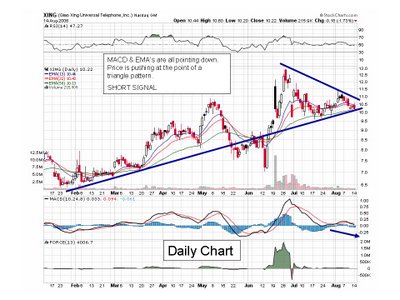
The daily chart looks like it confirms the long-term trend. I plan to short it tomorrow.
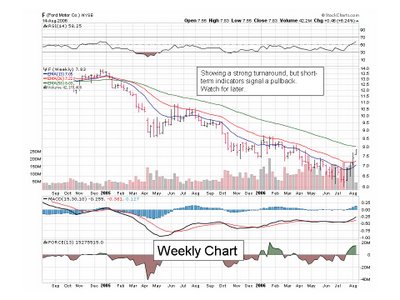
I heard last week that Ford just hired a new executive who is experienced in M&A (mergers & acquisitions). With all this talk about how Mr. William C. Ford Jr. should maybe look into taking the company private, this seems like a very smart move. So, I decided to check them out as a turnaround target. The weekly chart above shows that a turnaround is, indeed, in progress. But, I'm afraid it's already long in the tooth, and I might wait for a minor correction to go long.
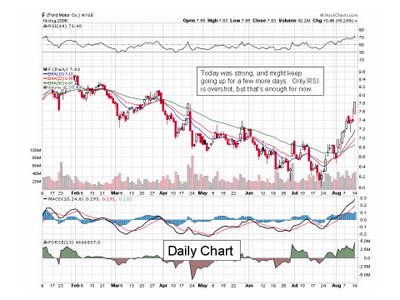
The daily chart shows the stock is still pretty strong. Only the RSI is getting into the "red zone" of the stock being overbought. All the other indicators show that this stock is going places, but I'll wait for a pullback before getting in. I just hope a pullback will be worth waiting!
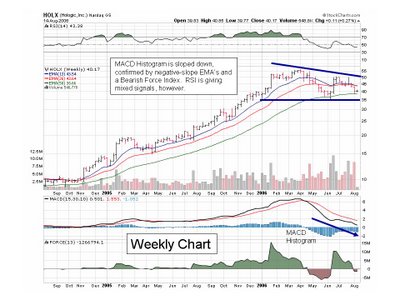
This is a stock that I did for a friend, just to see what it looks like. And it doesn't look pretty. This stock looks like it's just going sideways after a nice runup, and I can't really tell after that. The primary MACD Histogram and EMA slopes are telling me to short, but the RSI is giving a mixed message. Perhaps I'm giving too much credit to RSI?
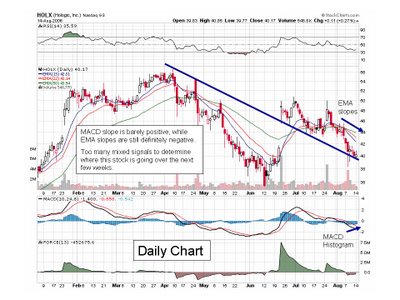
3 out of 5 indicators are telling me to short, and that's just not confident enough for me to make a solid decision. RSI and MACD histogram slope are going up, but this is short-term, and I'm really not too attached to the trendline that I have drawn. If I had to guess, I'd say HOLX will go up for a brief rally, then come back down in toward my support line.
First, I looked at a weekly chart of a stock to search for targets, then a daily chart. Using Stockcharts.com, I keep their format of RSI on top, MACD below, but place a Force Index below that, and use three exponential moving averages (EMA) in the main chart. Here's three stocks below:
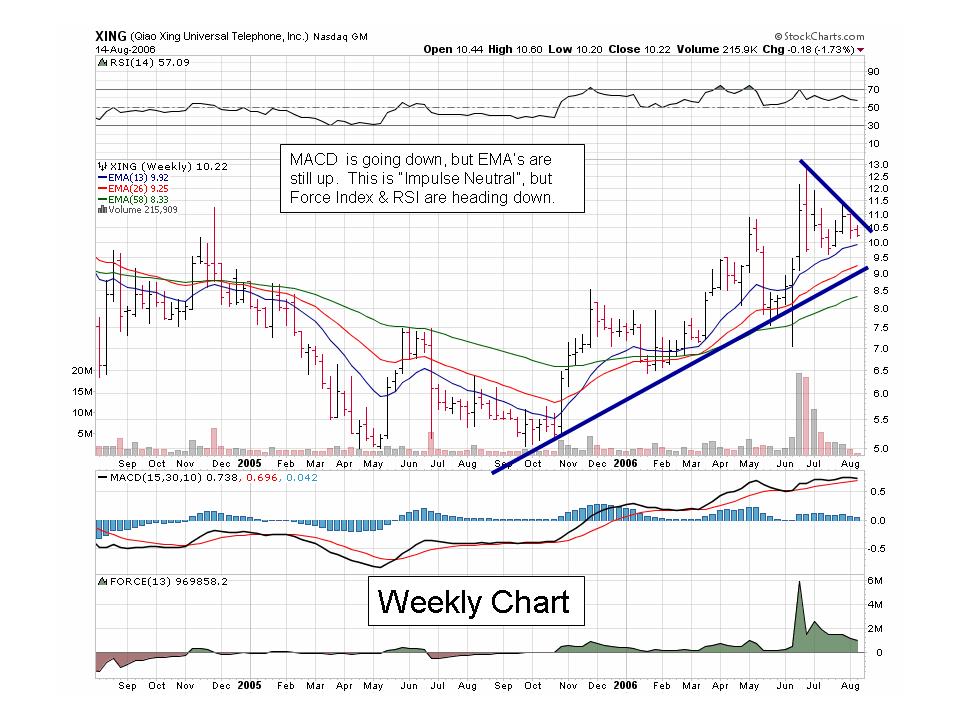
XING looks like it's getting ready to drop. The weekly chart above has a few indicators pointing toward a long-term drop. So I check the daily chart for recent trends.

The daily chart looks like it confirms the long-term trend. I plan to short it tomorrow.
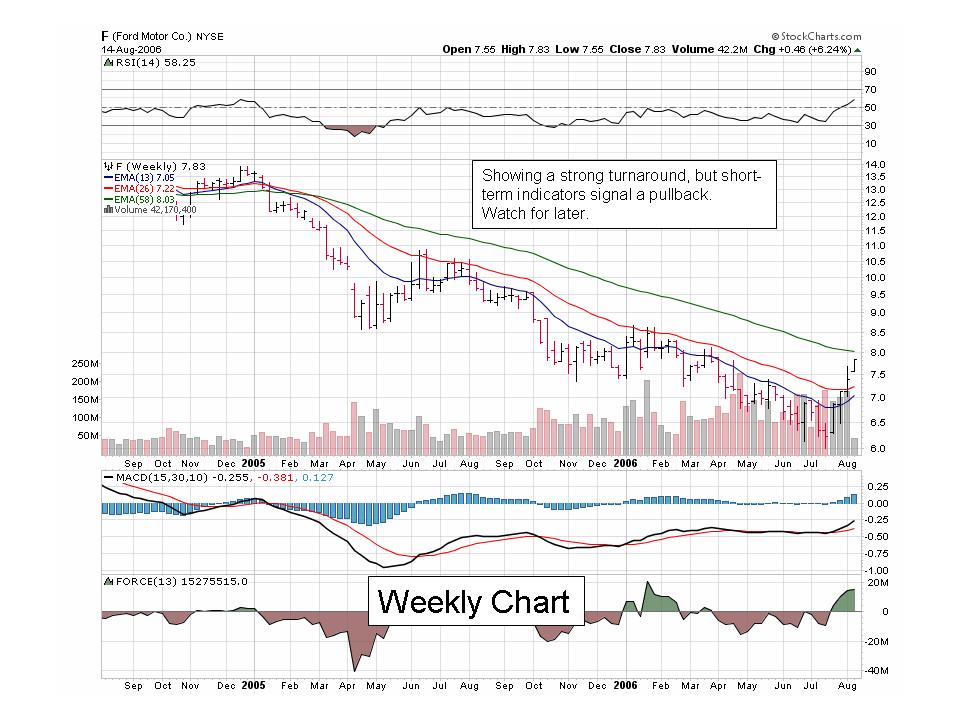
I heard last week that Ford just hired a new executive who is experienced in M&A (mergers & acquisitions). With all this talk about how Mr. William C. Ford Jr. should maybe look into taking the company private, this seems like a very smart move. So, I decided to check them out as a turnaround target. The weekly chart above shows that a turnaround is, indeed, in progress. But, I'm afraid it's already long in the tooth, and I might wait for a minor correction to go long.

The daily chart shows the stock is still pretty strong. Only the RSI is getting into the "red zone" of the stock being overbought. All the other indicators show that this stock is going places, but I'll wait for a pullback before getting in. I just hope a pullback will be worth waiting!
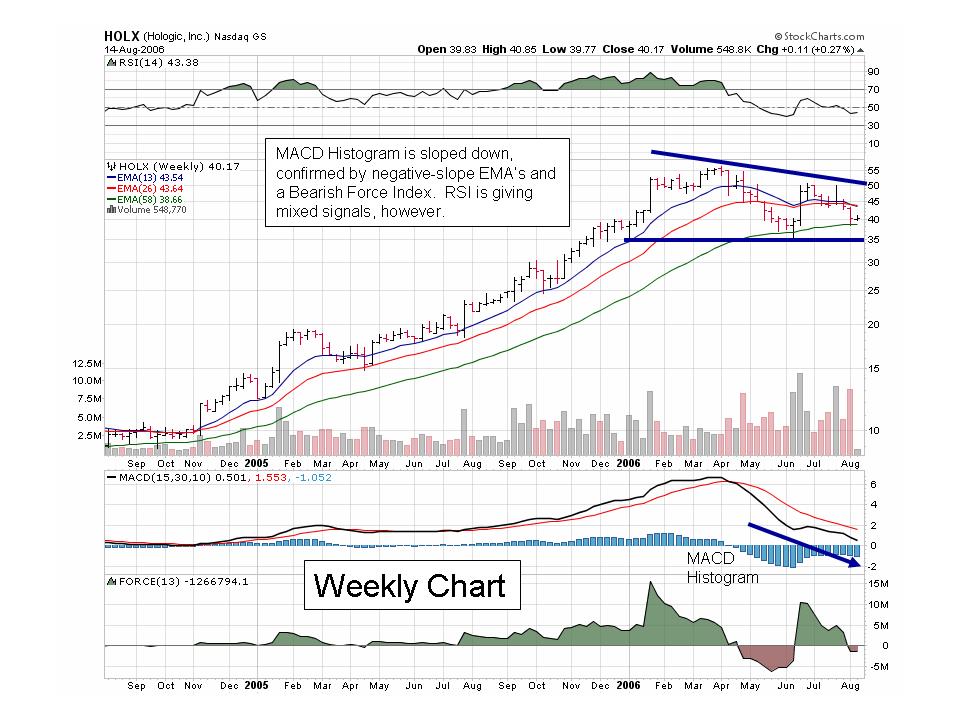
This is a stock that I did for a friend, just to see what it looks like. And it doesn't look pretty. This stock looks like it's just going sideways after a nice runup, and I can't really tell after that. The primary MACD Histogram and EMA slopes are telling me to short, but the RSI is giving a mixed message. Perhaps I'm giving too much credit to RSI?
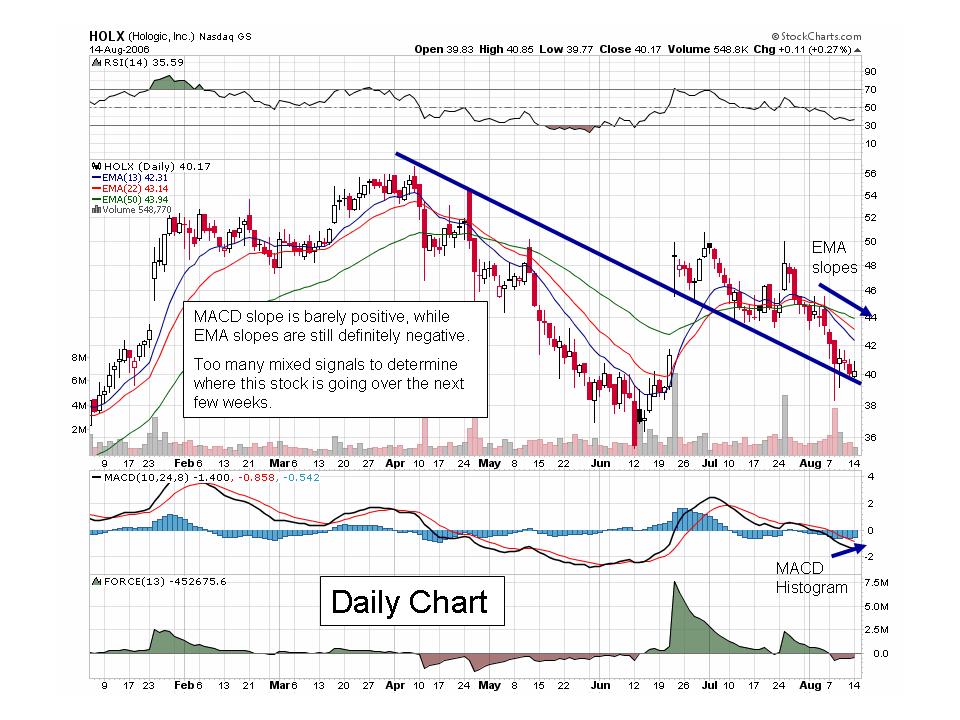
3 out of 5 indicators are telling me to short, and that's just not confident enough for me to make a solid decision. RSI and MACD histogram slope are going up, but this is short-term, and I'm really not too attached to the trendline that I have drawn. If I had to guess, I'd say HOLX will go up for a brief rally, then come back down in toward my support line.
Sunday, August 13, 2006
Feeding My Head
I'd like to take a moment to mention a couple of the books which I am currently reading through. The first one is called, "Ahead of the Curve: A Commonsense Guide to Forecasting Business and Market Cycles", by Joseph H. Ellis. It has opened my eyes to some common sense macro-economics that I had never before understood. The basic premise is that the primary driver of an economy is consumer spending, and it is best measured in year-over-year percentage changes. Of course, there is so much more, or else it would be quite a short book! Heh.
The second book arrived yesterday, so I have put the first book on pause in my eagerness to read the new one. It is called, "Entries and Exits: Visits to Sixteen Trading Rooms" by Dr. Alexander Elder (I paid less than $50 after shipping at Half.com). I'm already about 1/4 into the book and devouring its insights from other traders. Since I don't know any traders personally, this has given me firsthand knowledge into several trading styles in detail. The book was written at an intermediate level of a Stock Market investor/trader, a level that I believe I am finally pushing into. I'm even proud to say that I had started developing similar approaches to reading charts that these professionals use. I should also mention that everyone in the book appears to be a pure technician.
Back to reality, it's time to take a break from reading to put some new knowledge and enthusiasm to use! Good luck on Monday!
The second book arrived yesterday, so I have put the first book on pause in my eagerness to read the new one. It is called, "Entries and Exits: Visits to Sixteen Trading Rooms" by Dr. Alexander Elder (I paid less than $50 after shipping at Half.com). I'm already about 1/4 into the book and devouring its insights from other traders. Since I don't know any traders personally, this has given me firsthand knowledge into several trading styles in detail. The book was written at an intermediate level of a Stock Market investor/trader, a level that I believe I am finally pushing into. I'm even proud to say that I had started developing similar approaches to reading charts that these professionals use. I should also mention that everyone in the book appears to be a pure technician.
Back to reality, it's time to take a break from reading to put some new knowledge and enthusiasm to use! Good luck on Monday!
Thursday, August 10, 2006
Score Another for the 'Terrorists'
Well, well, well. A plot was foiled in which "liquid explosives" were going to be used to detonate airlines in the air. So what's the kneejerk reaction? Immediately confiscate ALL liquids brought on by passengers today... and for who knows how long? I didn't hear of a single incident of any liquid explosives actually being confiscated today, nor would we.
Now, thousands upon thousands of innocent people have been severely inconvenienced, frustrated, annoyed, and forced to play a part in this charade to tell the world that we are on guard. I was so close to have been traveling this weekend, but now I might not even return back to my contract job in Connecticut just to avoid having to deal with airport security to fly home for the weekend! It was already bad enough that ticket prices are rising.
And how about those markets today? The talking heads at CNBC were all giving their commentary and analysis on why the markets didn't plummet, and why crude oil fell, bonds are up, etc, etc... I still have my theory that there's a lot of active players in the Market, all trying to out-step each other. Everyone's thinking two or three steps down the road, but it's still all speculation. Crude oil dropped, 'because demand for jet fuel will be reduced as people are too scared to fly,' yet the airlines regained their opening losses. Gold dropped while T-Bonds climbed. The dollar rose as the TV journalists claimed it was 'fear in Europe, security in the US.'
It was an up-day today, but the markets opened down as the pre-bell news had the early risers in fear. I'm starting to hear more talking heads say that we should see some better days in the markets for the next month or two, followed by a squall-line of thunderstorms due to a cold front in late Fall. After that, possibly a Santa Claus Rally preceding the final doom-&-gloom final Bear rally in early '07.
Check out these 10-yr charts of the S&P 500.
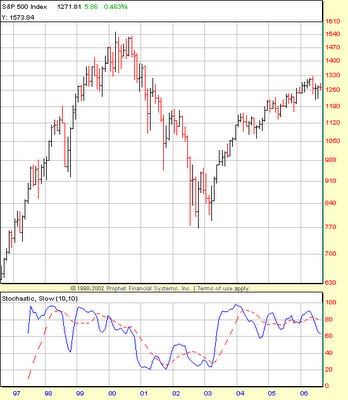
The lower graph is the Slow Stochastics. During this past 3-yr rally, the SS has indicated bullish and bearish runs in an almost regular interval, although the degree of change has gradually reduced. This has continued until the most recent bearish run, where the degree of weakness is greater, possibly indicating a weakening state. This also concerns me because the SS is showing that it may be preparing to reverse into a bullish run, the current prices don't support that. Slow Stochastics are a lagging indicator, so the S&P 500 should be heading back north, which it is not.
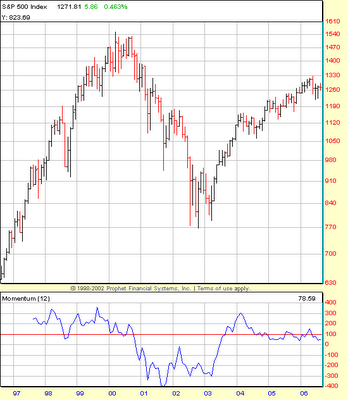
The momentum indicator shown above also supports that the 3-yr Bull Run lost most of its power after the first year. It's had lackluster support through modest gains for 2 years, but does look due for another temporary runup for the next 4-6 months.
Might be time to cover my shorts... for now.
Now, thousands upon thousands of innocent people have been severely inconvenienced, frustrated, annoyed, and forced to play a part in this charade to tell the world that we are on guard. I was so close to have been traveling this weekend, but now I might not even return back to my contract job in Connecticut just to avoid having to deal with airport security to fly home for the weekend! It was already bad enough that ticket prices are rising.
And how about those markets today? The talking heads at CNBC were all giving their commentary and analysis on why the markets didn't plummet, and why crude oil fell, bonds are up, etc, etc... I still have my theory that there's a lot of active players in the Market, all trying to out-step each other. Everyone's thinking two or three steps down the road, but it's still all speculation. Crude oil dropped, 'because demand for jet fuel will be reduced as people are too scared to fly,' yet the airlines regained their opening losses. Gold dropped while T-Bonds climbed. The dollar rose as the TV journalists claimed it was 'fear in Europe, security in the US.'
It was an up-day today, but the markets opened down as the pre-bell news had the early risers in fear. I'm starting to hear more talking heads say that we should see some better days in the markets for the next month or two, followed by a squall-line of thunderstorms due to a cold front in late Fall. After that, possibly a Santa Claus Rally preceding the final doom-&-gloom final Bear rally in early '07.
Check out these 10-yr charts of the S&P 500.
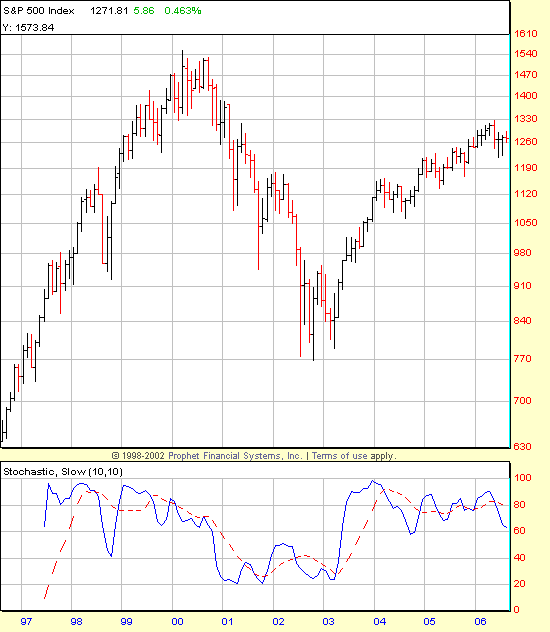
The lower graph is the Slow Stochastics. During this past 3-yr rally, the SS has indicated bullish and bearish runs in an almost regular interval, although the degree of change has gradually reduced. This has continued until the most recent bearish run, where the degree of weakness is greater, possibly indicating a weakening state. This also concerns me because the SS is showing that it may be preparing to reverse into a bullish run, the current prices don't support that. Slow Stochastics are a lagging indicator, so the S&P 500 should be heading back north, which it is not.
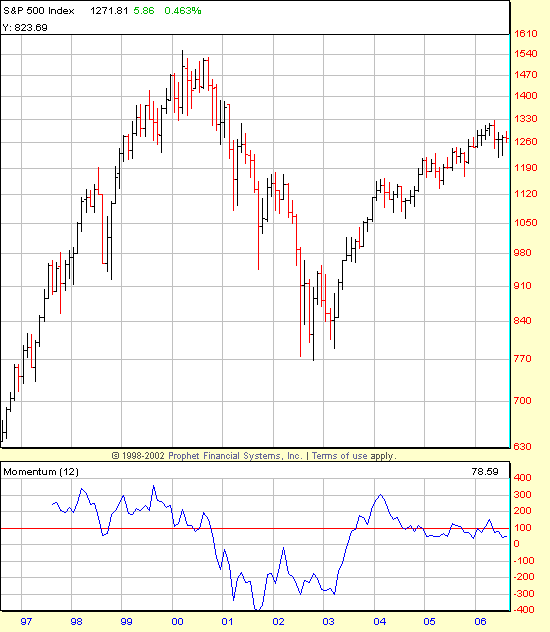
The momentum indicator shown above also supports that the 3-yr Bull Run lost most of its power after the first year. It's had lackluster support through modest gains for 2 years, but does look due for another temporary runup for the next 4-6 months.
Might be time to cover my shorts... for now.
Monday, August 07, 2006
Back in the Saddle
As I sit on my couch this morning, flipping between CNBC and Bloomberg, I realize that I missed a very interesting day last Friday. I spent the day driving back home to Florida from my temp-job in Connecticut. This morning, I see that everyone is making their final bets on Tuesday's Fed Rate. It's still all about the Fed Watch.
I want someone to start "Hedge Fund Watch." These guys are all tripping over each other, trying to out maneuver the next guy by getting in first on any news. That's still my best explanation as to why GDP is reported down (the economy is slowing!!!) and the market rallies for 6 days. The Wall Street short-term thinking is still the way it always was, but now there is more money in the hands of those who would trade the news. I say betting around the HF's might be a good strategy: see where the money flows on crazy news, and then hedge against it. Could you call that a "Fund Against Funds"?
Futures are down, Europe is down. Is it finally safe to go short on some of those stocks that shot up last week on up-earnings? Volume seems to support that, so here's hoping I can get the money back I lost!
It'll be nice to have Bloomberg again. The hotel I was staying at only had CNBC, and they do somthing in their ads that annoys me. CNBC is constructing their advertising in an attempt to prove to my why I SHOULD be watching them. Notice what Becky Quick says right before commercial on Squawk Box, or the ads as to why we should be watching Fast Money. Granted, I like hearing real day-traders talk (since I don't know any personally), I have to add some salt to the conversation given the venue.
I want someone to start "Hedge Fund Watch." These guys are all tripping over each other, trying to out maneuver the next guy by getting in first on any news. That's still my best explanation as to why GDP is reported down (the economy is slowing!!!) and the market rallies for 6 days. The Wall Street short-term thinking is still the way it always was, but now there is more money in the hands of those who would trade the news. I say betting around the HF's might be a good strategy: see where the money flows on crazy news, and then hedge against it. Could you call that a "Fund Against Funds"?
Futures are down, Europe is down. Is it finally safe to go short on some of those stocks that shot up last week on up-earnings? Volume seems to support that, so here's hoping I can get the money back I lost!
It'll be nice to have Bloomberg again. The hotel I was staying at only had CNBC, and they do somthing in their ads that annoys me. CNBC is constructing their advertising in an attempt to prove to my why I SHOULD be watching them. Notice what Becky Quick says right before commercial on Squawk Box, or the ads as to why we should be watching Fast Money. Granted, I like hearing real day-traders talk (since I don't know any personally), I have to add some salt to the conversation given the venue.
Tuesday, August 01, 2006
Crazy Markets!
So, what's going on? There is so much debate on whether the markets are coming back to rally, or what. Look at these charts, the DOW and NASDAQ show signs of leveling off their declines and making a comeback.
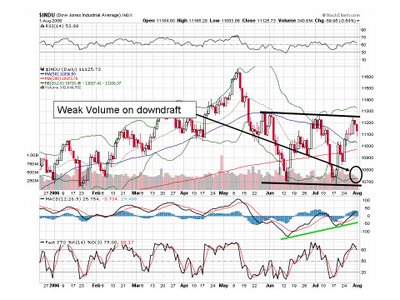
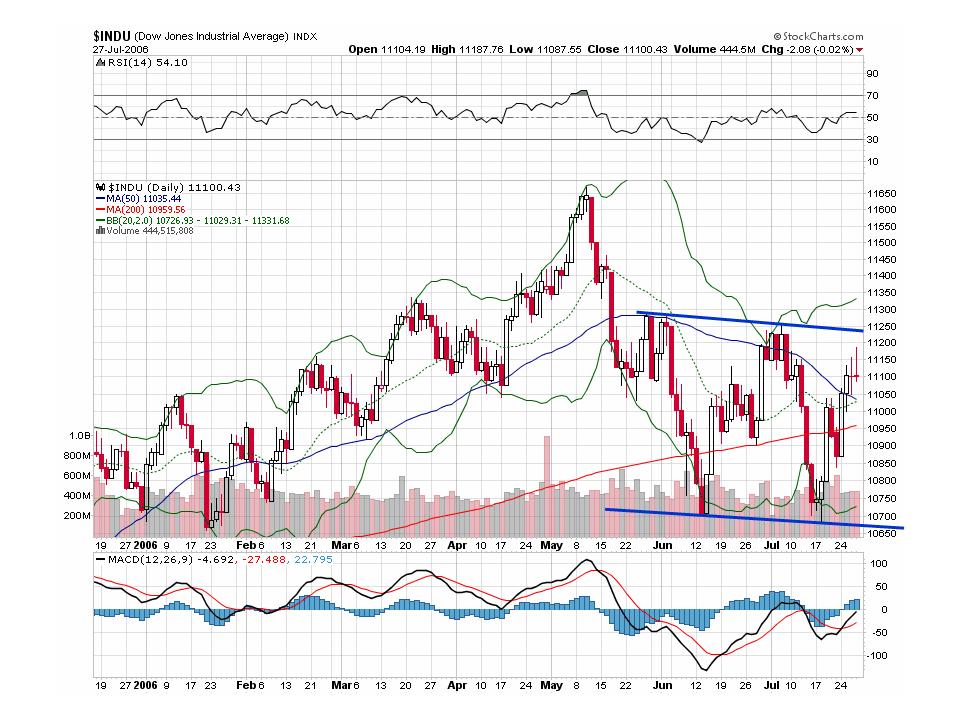
The Dow's got a nice channel going. But the MACD indicates that it might not head back down to the support line. Hmmm, a good sign.
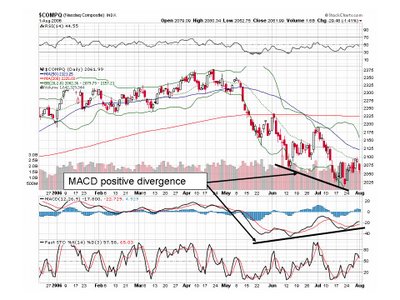
The NASDAQ doesn't have too much to go with. But there is the same positive divergence as the DOW. Another good sign.
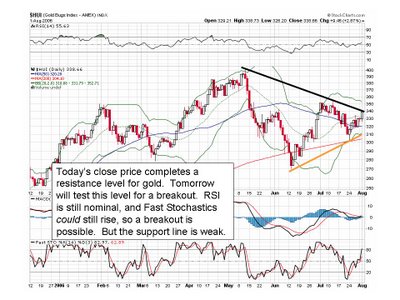
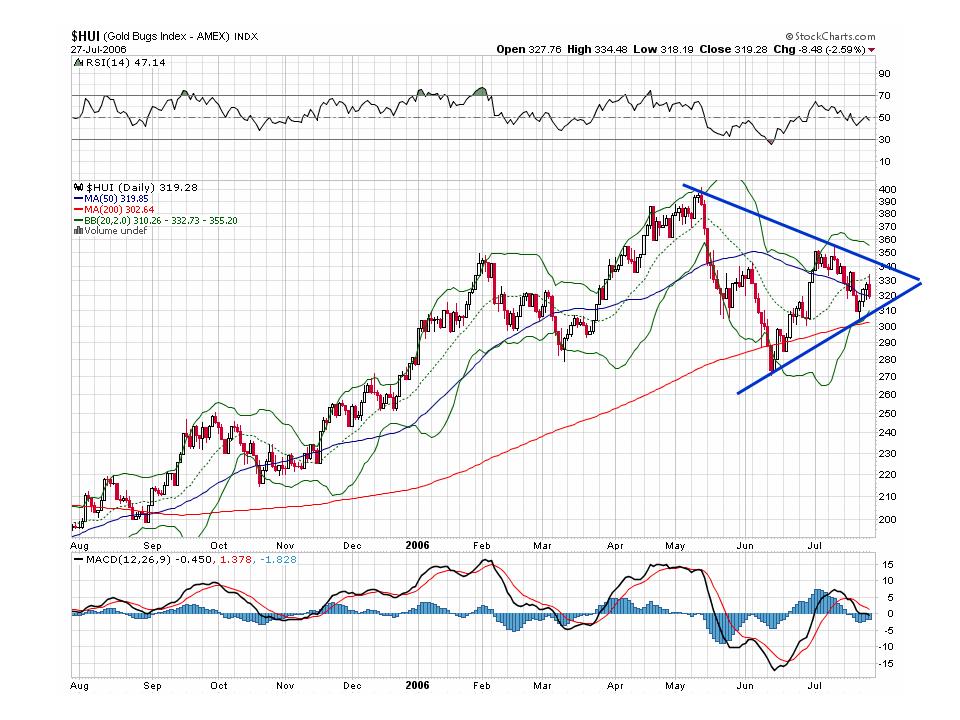
The Gold Bugs Index closed today with a price that confirms a resistance level. If it goes up tomorrow, I might consider that a breakout. If it goes down, however, then I'd say we're still waiting for the next FED guidance.
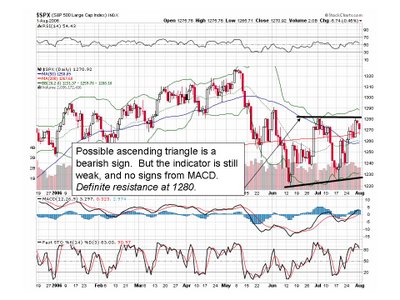
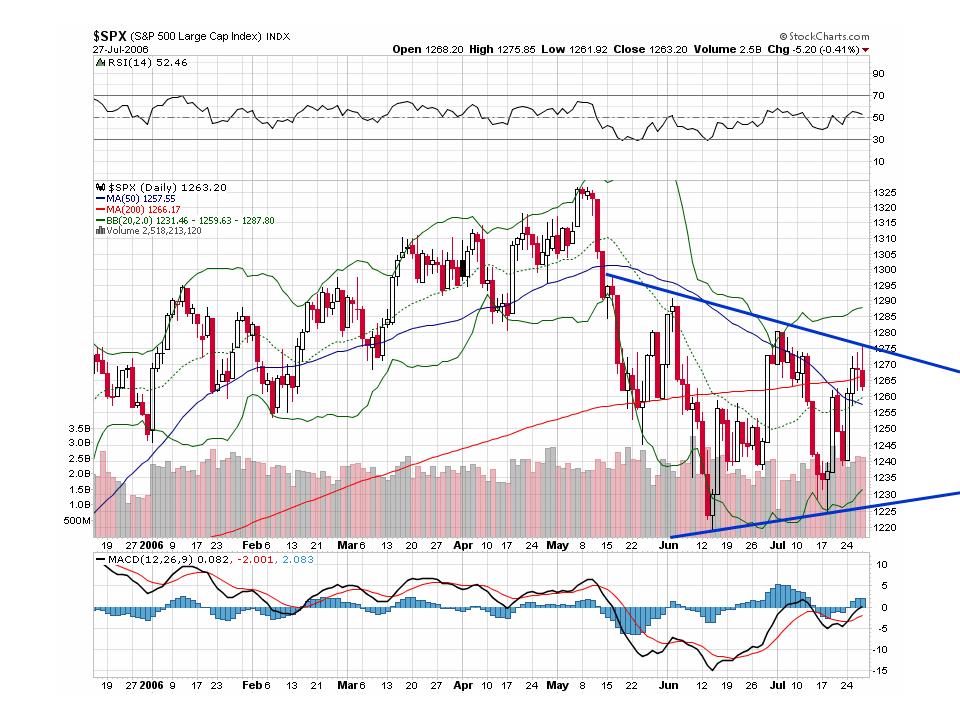
The S&P 500 looks like it's moving nicely in a new channel. I don't see a lot pattern confidence here except the resistance level. This might not be a good sign, except consistent bouncing against the resistance might indicate a desparate attempt to break out.
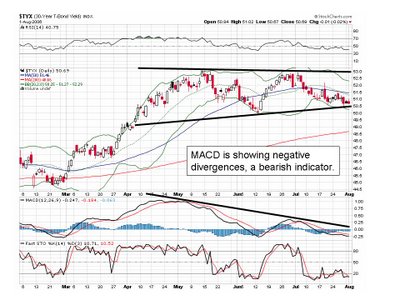
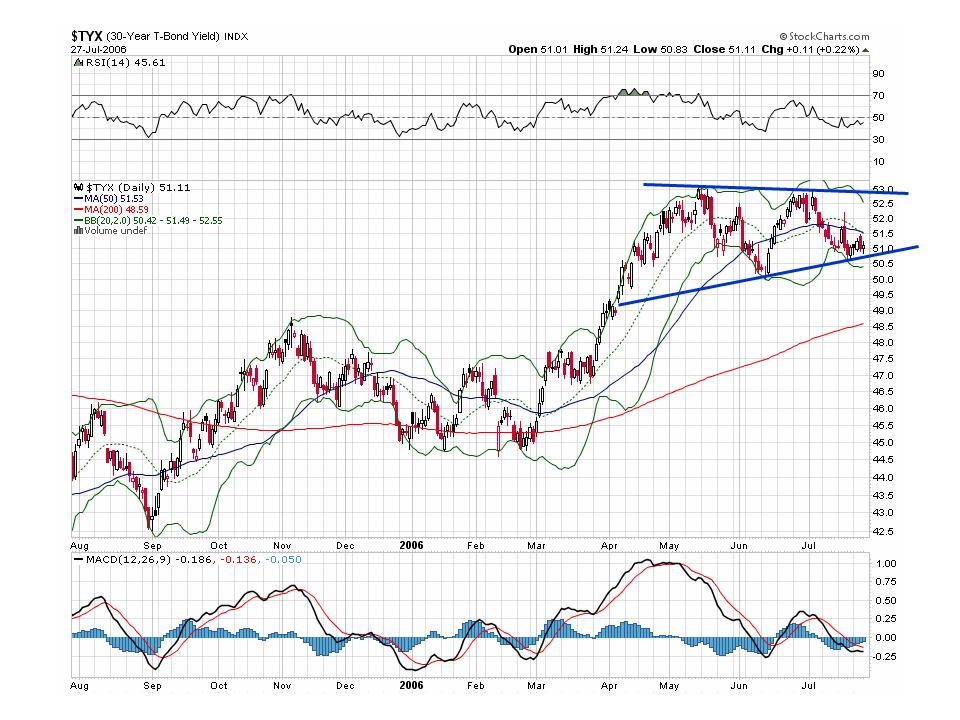
Finally, the bond rate. Bonds seem to be confirming the statements made by PIMCO's Bill Gross last Friday. He forsees a Bond rally soon. Bonds should be rising in the near future, perhaps after one more ride up the channel as the daily talking heads pump up the Fed Watch.
But if Bond prices go up, aren't the stocks supposed to go down?
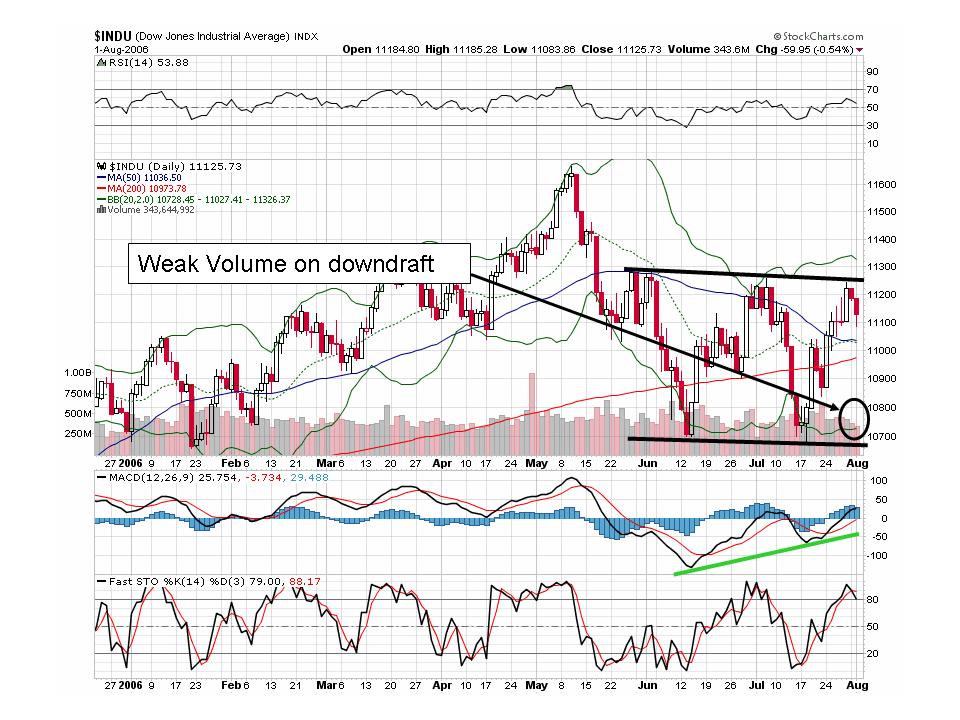
The Dow's got a nice channel going. But the MACD indicates that it might not head back down to the support line. Hmmm, a good sign.

The NASDAQ doesn't have too much to go with. But there is the same positive divergence as the DOW. Another good sign.
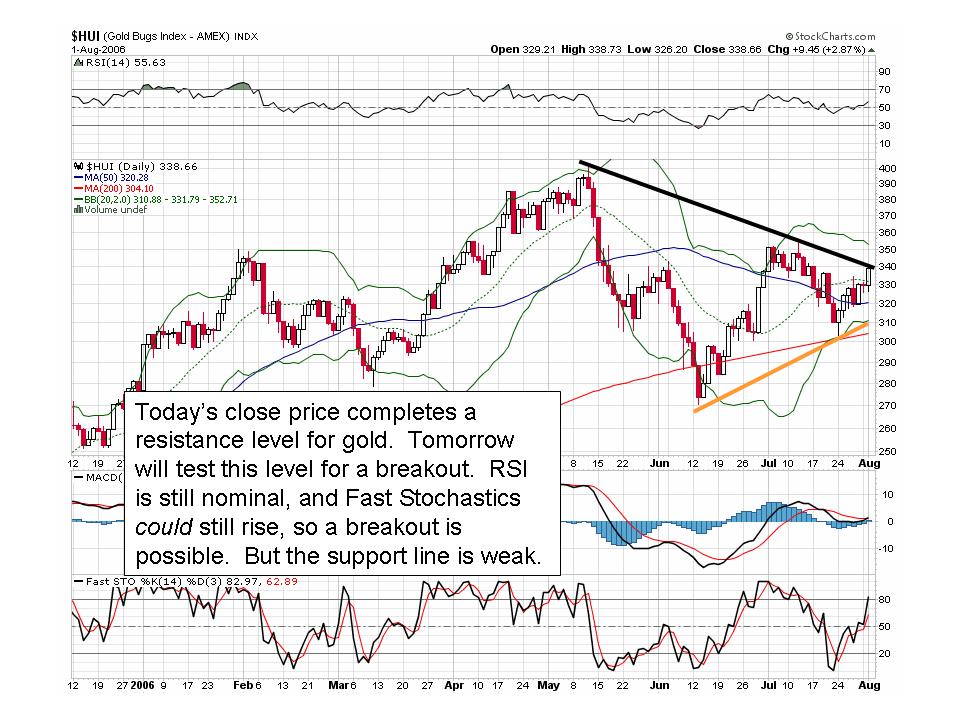
The Gold Bugs Index closed today with a price that confirms a resistance level. If it goes up tomorrow, I might consider that a breakout. If it goes down, however, then I'd say we're still waiting for the next FED guidance.

The S&P 500 looks like it's moving nicely in a new channel. I don't see a lot pattern confidence here except the resistance level. This might not be a good sign, except consistent bouncing against the resistance might indicate a desparate attempt to break out.

Finally, the bond rate. Bonds seem to be confirming the statements made by PIMCO's Bill Gross last Friday. He forsees a Bond rally soon. Bonds should be rising in the near future, perhaps after one more ride up the channel as the daily talking heads pump up the Fed Watch.
But if Bond prices go up, aren't the stocks supposed to go down?
Monday, July 31, 2006
Can Money Buy Happiness?
"Well, the answer is it can, but it takes a lot. "
--Dr. David Blanchflower, Dartmouth College
Sunday, Feb. 12, 2006 in an interview with James Reese on RadioEconomics.com.
How about that real estate bust goin' down? I'm reading more and more articles about developers pulling out of projects, mounting new home inventories, and falling prices. Is this a good time to become a landlord in my area? And what about all those houses built with immigrant labor in a hurry? How's the quality going to be a few years down the road?
I think this week will be a moment of truth for the markets. After last week's rally, will we see a full turnaround this week? I'm still bearish, myself.
--Dr. David Blanchflower, Dartmouth College
Sunday, Feb. 12, 2006 in an interview with James Reese on RadioEconomics.com.
How about that real estate bust goin' down? I'm reading more and more articles about developers pulling out of projects, mounting new home inventories, and falling prices. Is this a good time to become a landlord in my area? And what about all those houses built with immigrant labor in a hurry? How's the quality going to be a few years down the road?
I think this week will be a moment of truth for the markets. After last week's rally, will we see a full turnaround this week? I'm still bearish, myself.
Thursday, July 27, 2006
The Current Index Picture; for reference
Dow Jones Industrial Average

30-yr Bond

S&P 500

Gold Bug Index

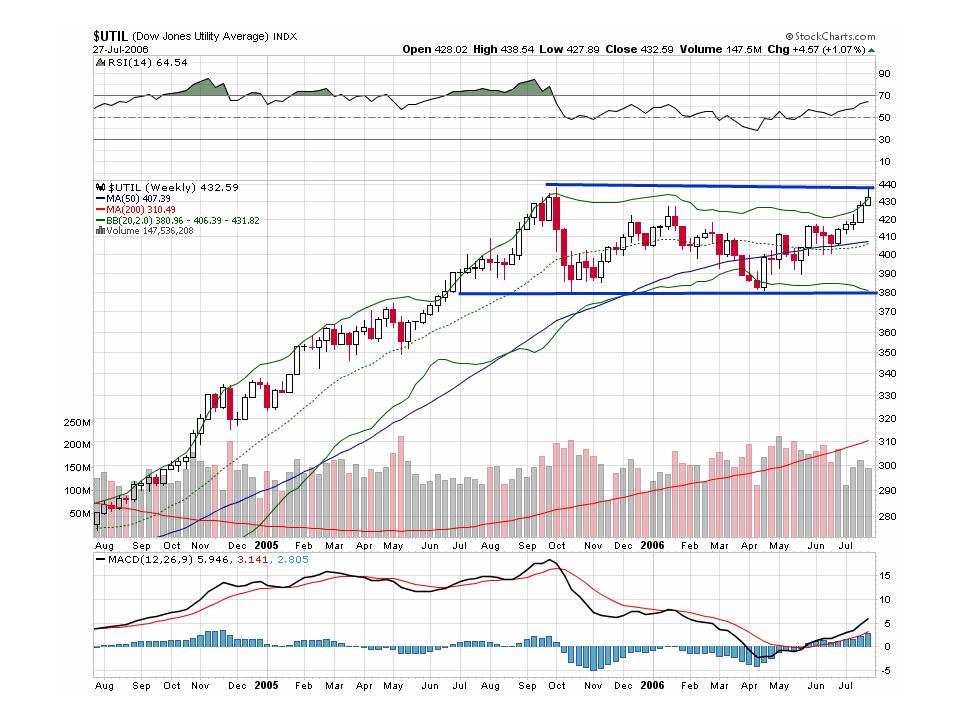
Dow Jones Utilities Index

30-yr Bond
S&P 500
Gold Bug Index
Dow Jones Utilities Index
Monday, July 24, 2006
Stocks for Tuesday
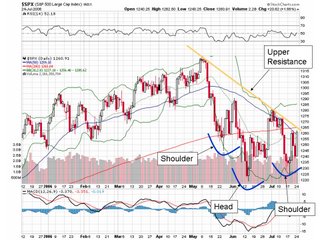
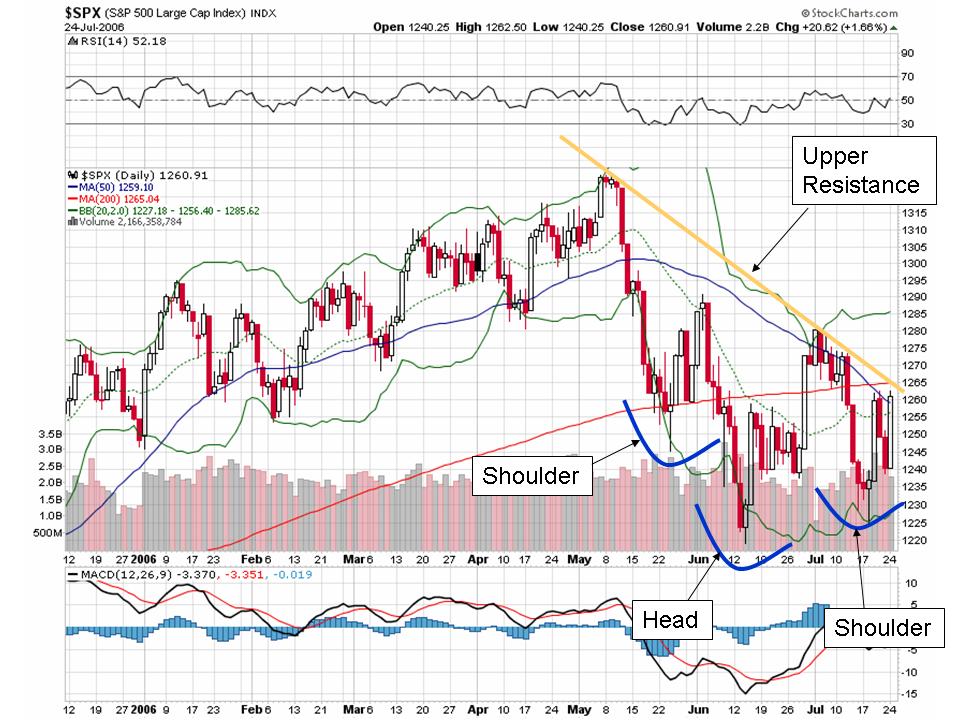
Here's the StockCharts.com charts that I promised. They might get cleaner in time, but here's first the updated S&P 500 chart, demonstrating my theory on the Inverse Head & Shoulder's coming up. Notice it's still within bounds
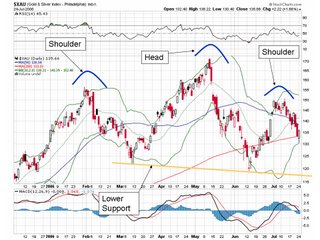
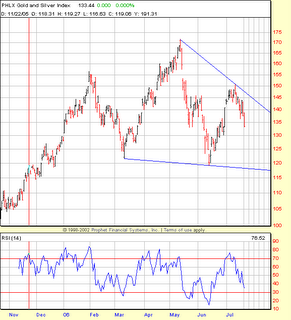
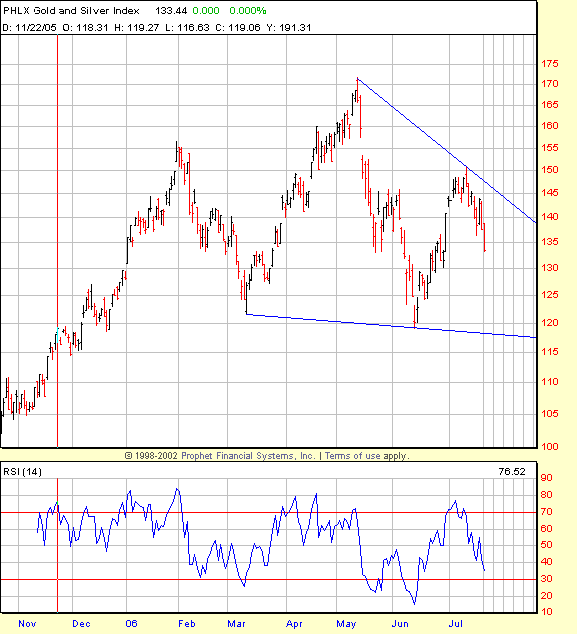
Next, is the Gold & Silver Index. I've outlined the normal Head & Shoulders that I see. I suppose it makes sense that it's moving opposite stocks, since Gold is a defence to falling stock prices.
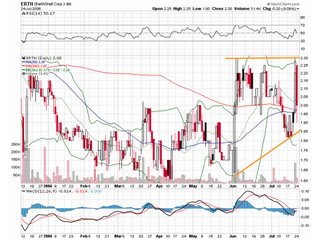
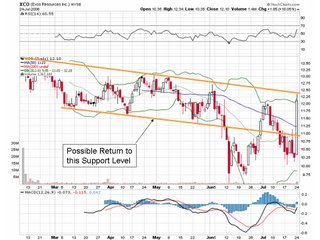
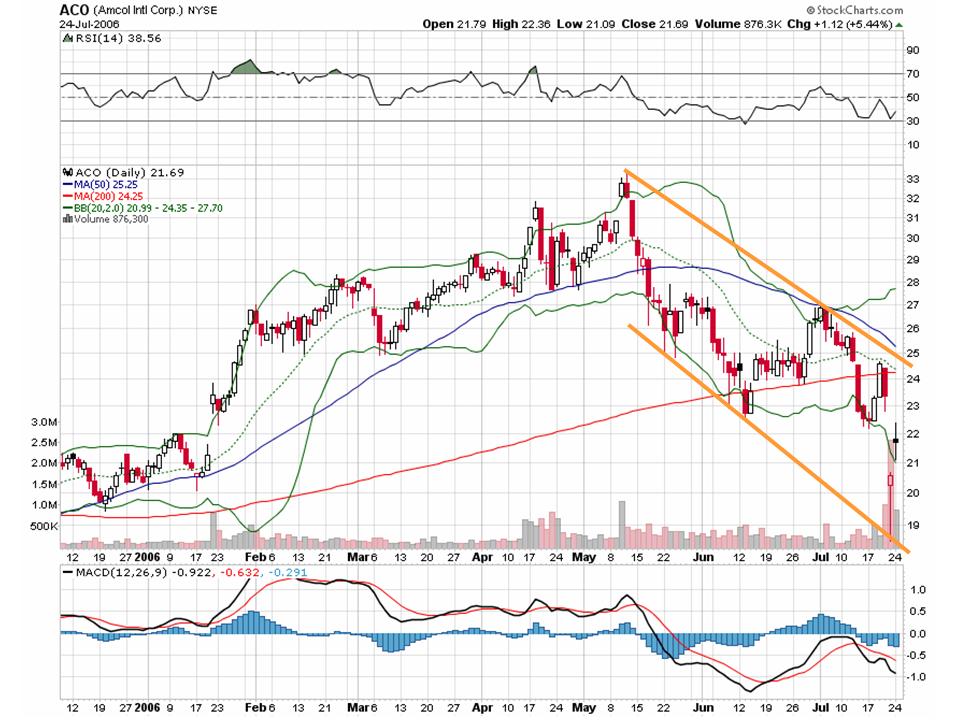
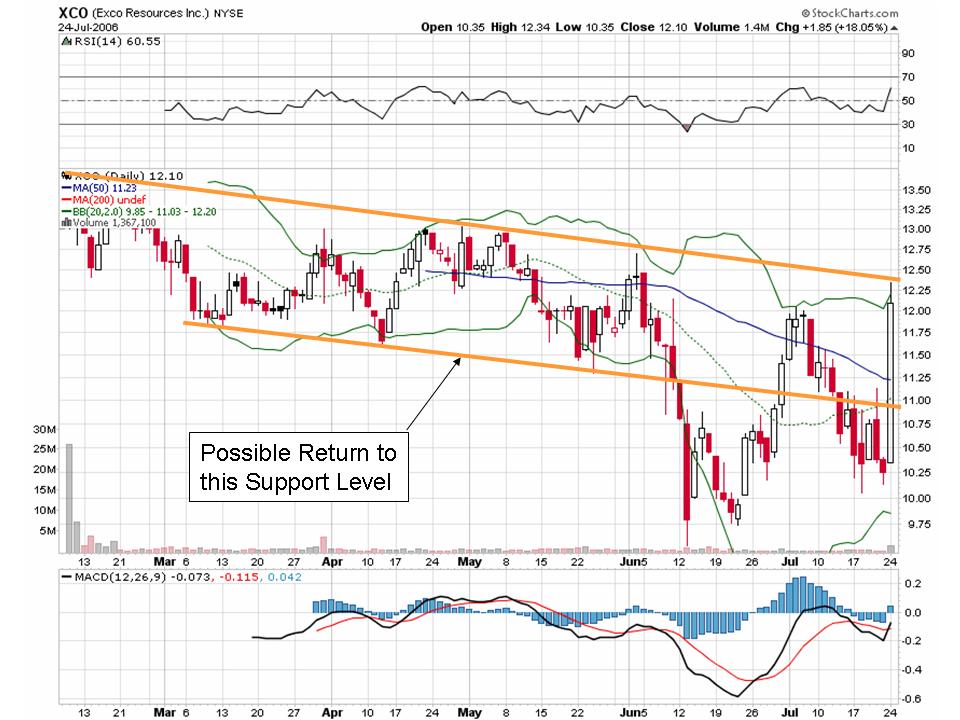
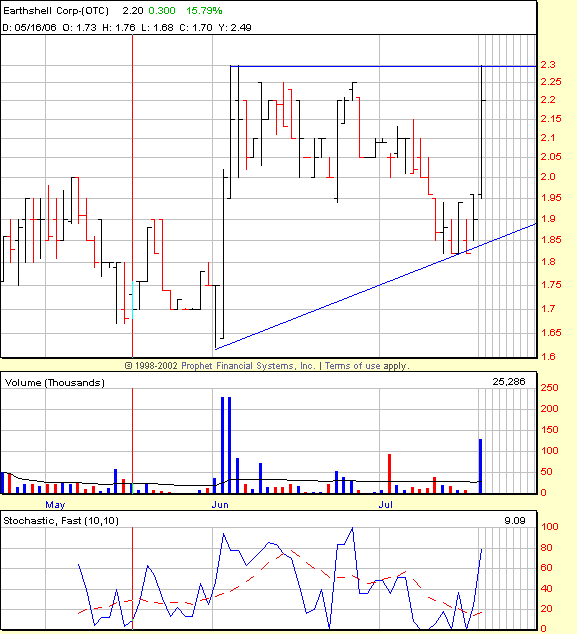
Here's the sum of the stuff from yesterday. ACO & ERTH stayed within bounds, and aren't going anywhere spectacular for tomorrow.

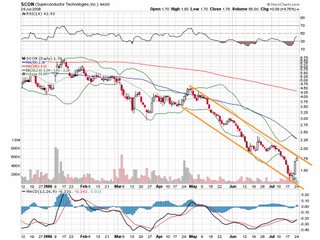
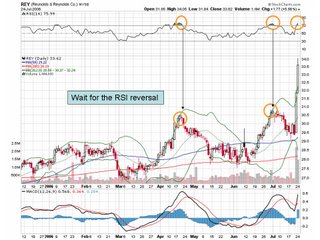
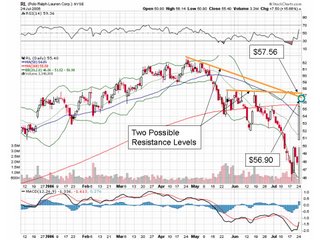
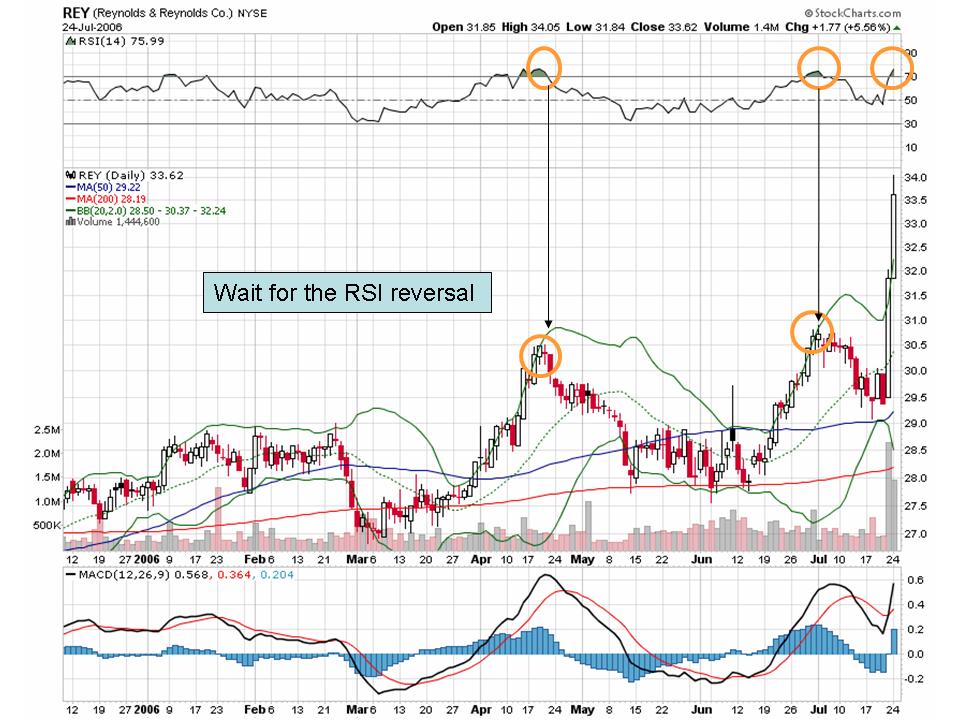
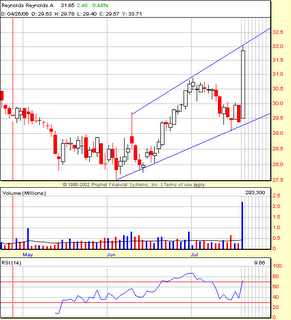
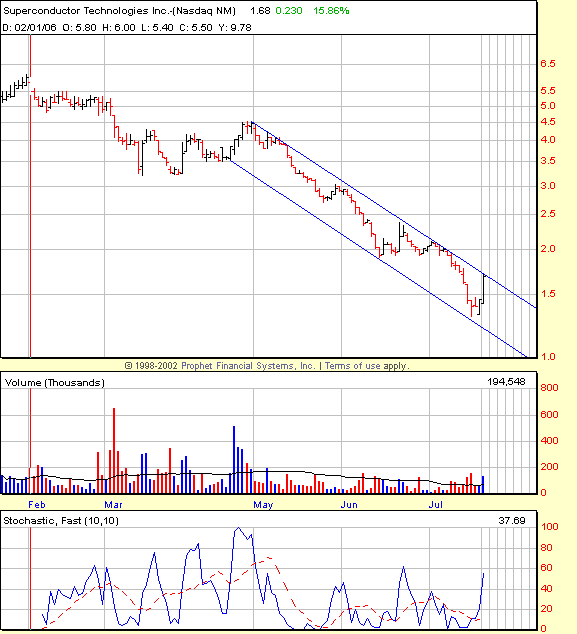
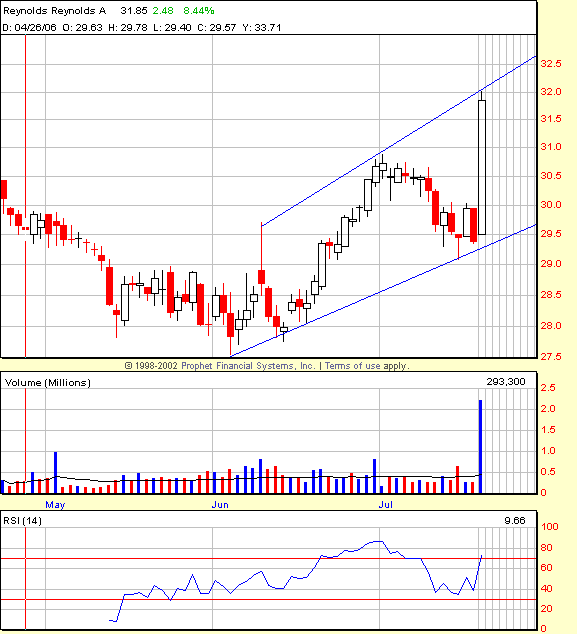
SCON & REY blew out my first upper resistance lines, but have defined new levels that could also work. SCON might go down tomorrow, but REY should be approached with a new tactic, watching the RSI for reversal, and then short.
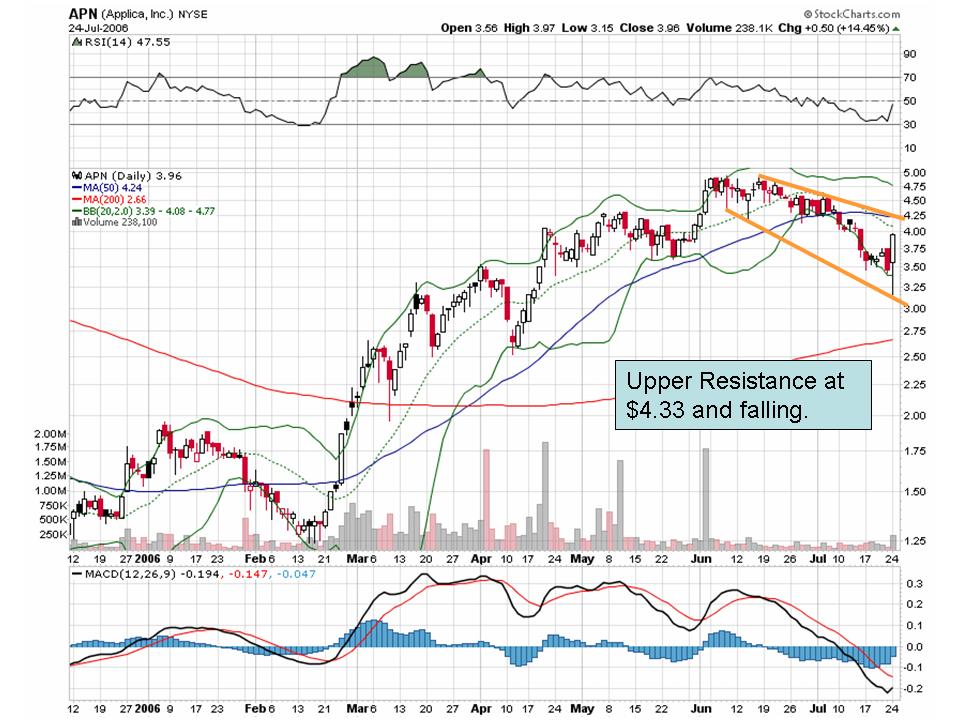
Here's the new market movers:
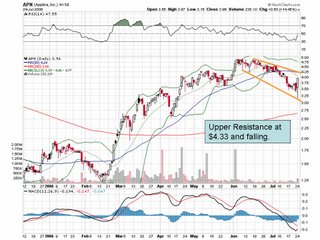
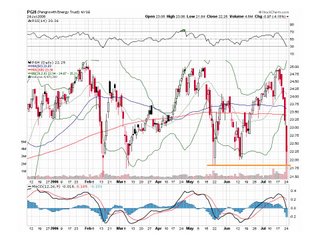
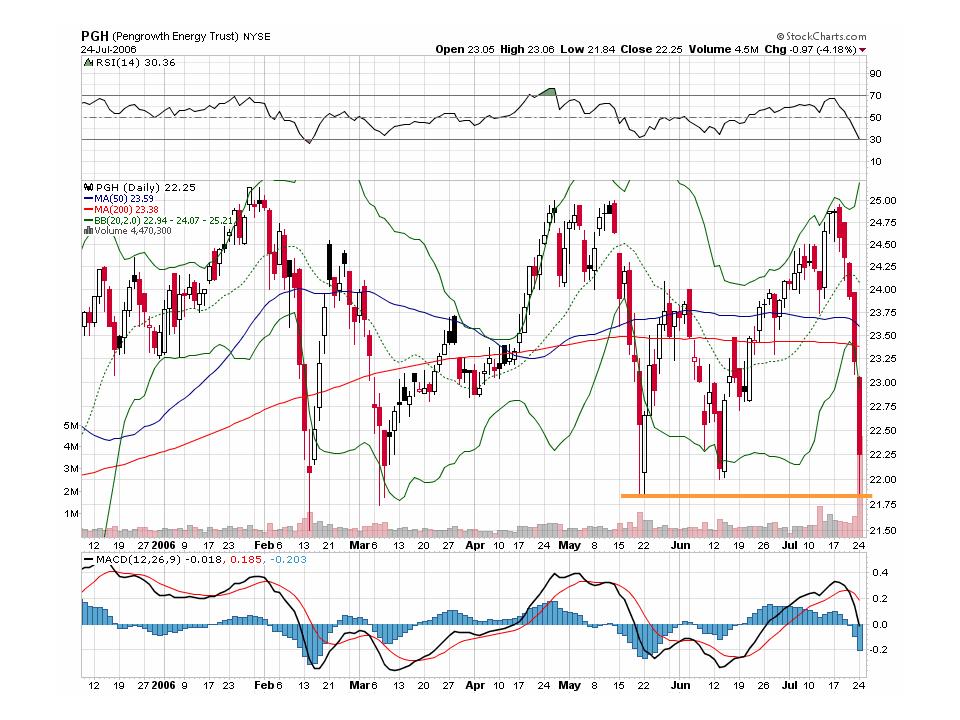
PGH just hit a lower support of $21.85. This should indicate it's time to go long.
Next, is the Gold & Silver Index. I've outlined the normal Head & Shoulders that I see. I suppose it makes sense that it's moving opposite stocks, since Gold is a defence to falling stock prices.

Here's the sum of the stuff from yesterday. ACO & ERTH stayed within bounds, and aren't going anywhere spectacular for tomorrow.

SCON & REY blew out my first upper resistance lines, but have defined new levels that could also work. SCON might go down tomorrow, but REY should be approached with a new tactic, watching the RSI for reversal, and then short.

Here's the new market movers:
PGH just hit a lower support of $21.85. This should indicate it's time to go long.

Sunday, July 23, 2006
Edgy Gets Technical; Stocks to watch for Monday
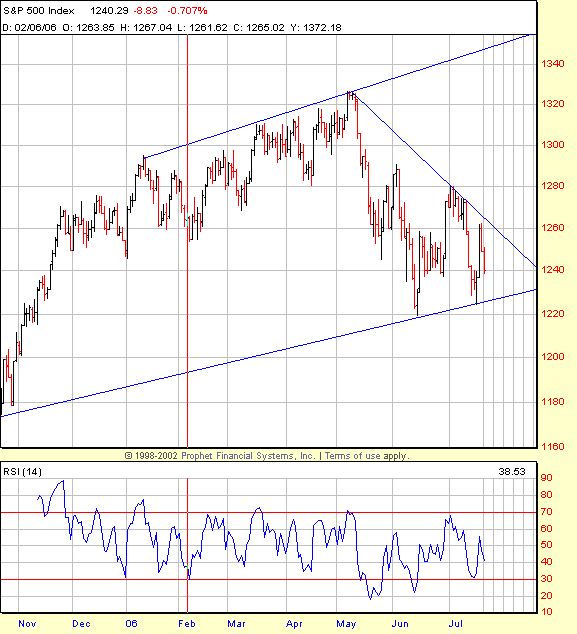
After reading up some more Technical Analysis (TA), I've attempted to put some line drawing to my charts. My first stop is at my old friend, the S&P 500. I hear some Technicians use two data points to draw their lines, while others use three. I suppose either will work, but three will allow for a greater confidence level. Here's the S&P 500 chart:
I've identified a possible channel, with more recent direction headed down. All these lines indicate that we should see brighter days after another week. Especially when this most recent data looks a bit like an inverted Head & Shoulders patter. The Pennant in the middle of the head might have broken up the pattern, I don't know. But I'll be watching for a breakout in gains if it crosses that sharply decreasing line at the end. Otherwise, it could fall through the support line and down we go.
S&P 500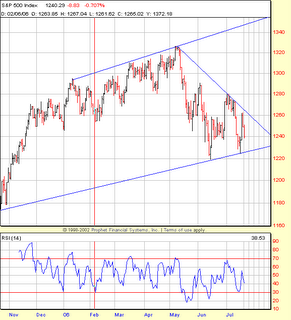
Next is the Gold & Silver Index. This looks like a VERY prominent Head & Shoulders pattern finishing up! If this is true, expect to see the price of gold falling within a week or two.
XAU
Next, I looked at the market movers from Friday. A few caught my eye for charting, and then I weeded a few more out to mention here. First is SCON:
SCON
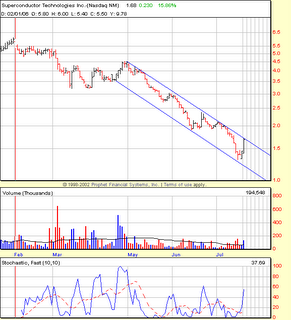
The lower line of the channel seems like a bit of a stretch since I don't feel too confident on the data points that created it. However, there are many data points to provide the upper resistance-line. According to this chart, SCON should not move above about $1.66 on Monday. However, this also looks like another possible inverted Head & Shoulders, albeit stretched out and slanted. If so, and SCON breaks above $1.66 tomorrow, it may be possible that it will keep on trucking up for a while, into a new trading range and/or pattern.
SCON probably has enough momentum to break through the resistance line right now. But the fighting between Israel and Lebanon is still hot & heavy, and now the UN is planning on sending in troops along the border when things settle down. That means more countries will be involved in this battle, and that should shake up the markets on Monday.
There's also REY. According to this resistance line, REY shouldn't move above about $32.11 Monday. But my experience has shown me that there are typically two more days of reduced-momentum up-days before this stock 'should' peter-out and drop. But with the bad news abroad, who know how people will feel after this weekend? It might just turn right around and go down. However, this stock looks good for the longer term. It's just at its resistance level and needs to cool off for a week or two. I'll be watching it to see how it pans out.
REY
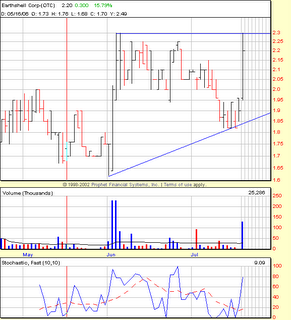
This is ERTH. There is a strong resistance line at $2.30, and another, weaker one at $2.25. The lower support is possibly out of context, but indicates that the price should drop when the triangle closes. I could have also drawn a lower support line starting right AFTER the first jump in price found in the middle of the chart. This would show a widening channel, or a megaphone, which is also a bad sign for the price. My guess is this stock will repeat the behavior of the previous price jump, and bounce its way back down.
ERTH
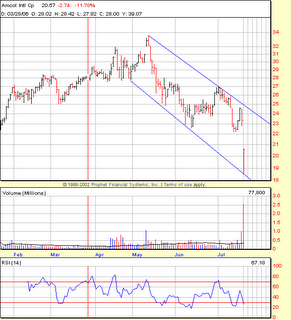
Finally, ACO. This seems to have a strong channel boundary, which indicates the price will most likely go up Monday, and shouldn't drop below $18.38 throughout the day. However, ACO closed pretty close to the channel midrange of a downward trend. This stock has a wide field to travel Monday, so it could really go anywhere. Normally, I might go long this stock after a drop like Friday's, but it may be best to just watch it a few more days to determine where it lies in the channel.
ACO
I'll see about making further charts using StockCharts.com, dressed up with more details on the chart itself. Until next time!
I've identified a possible channel, with more recent direction headed down. All these lines indicate that we should see brighter days after another week. Especially when this most recent data looks a bit like an inverted Head & Shoulders patter. The Pennant in the middle of the head might have broken up the pattern, I don't know. But I'll be watching for a breakout in gains if it crosses that sharply decreasing line at the end. Otherwise, it could fall through the support line and down we go.
S&P 500
Next is the Gold & Silver Index. This looks like a VERY prominent Head & Shoulders pattern finishing up! If this is true, expect to see the price of gold falling within a week or two.
XAU
Next, I looked at the market movers from Friday. A few caught my eye for charting, and then I weeded a few more out to mention here. First is SCON:
SCON
The lower line of the channel seems like a bit of a stretch since I don't feel too confident on the data points that created it. However, there are many data points to provide the upper resistance-line. According to this chart, SCON should not move above about $1.66 on Monday. However, this also looks like another possible inverted Head & Shoulders, albeit stretched out and slanted. If so, and SCON breaks above $1.66 tomorrow, it may be possible that it will keep on trucking up for a while, into a new trading range and/or pattern.
SCON probably has enough momentum to break through the resistance line right now. But the fighting between Israel and Lebanon is still hot & heavy, and now the UN is planning on sending in troops along the border when things settle down. That means more countries will be involved in this battle, and that should shake up the markets on Monday.
There's also REY. According to this resistance line, REY shouldn't move above about $32.11 Monday. But my experience has shown me that there are typically two more days of reduced-momentum up-days before this stock 'should' peter-out and drop. But with the bad news abroad, who know how people will feel after this weekend? It might just turn right around and go down. However, this stock looks good for the longer term. It's just at its resistance level and needs to cool off for a week or two. I'll be watching it to see how it pans out.
REY
This is ERTH. There is a strong resistance line at $2.30, and another, weaker one at $2.25. The lower support is possibly out of context, but indicates that the price should drop when the triangle closes. I could have also drawn a lower support line starting right AFTER the first jump in price found in the middle of the chart. This would show a widening channel, or a megaphone, which is also a bad sign for the price. My guess is this stock will repeat the behavior of the previous price jump, and bounce its way back down.
ERTH
Finally, ACO. This seems to have a strong channel boundary, which indicates the price will most likely go up Monday, and shouldn't drop below $18.38 throughout the day. However, ACO closed pretty close to the channel midrange of a downward trend. This stock has a wide field to travel Monday, so it could really go anywhere. Normally, I might go long this stock after a drop like Friday's, but it may be best to just watch it a few more days to determine where it lies in the channel.
ACO
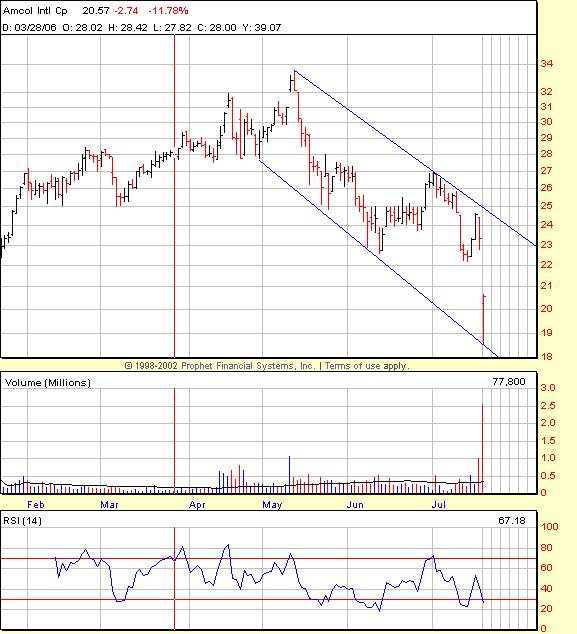
I'll see about making further charts using StockCharts.com, dressed up with more details on the chart itself. Until next time!
Friday, July 21, 2006
Recession or Lull?
All the gains from the bounce are about gone, and we're back on track to more down-days. Although I hear murmurings of 'recession' now, I wouldn't go that far. I'm just watching the markets and seeing short-term negativity. Of course, I'm only looking short-term.
I suspect that the fighting in Isreal & Lebannon has upstaged the Fed Watch, as Treasuries are finally moving independent of the Fed Rate. I've got some Bonds at 4.9% (darn commisions!), so I say, "bring on the recession fears!". Fear of recession will raise my bond prices so I can eventually sell those and move back into equities. I've begun dabbling in day-trading and learning that I should maybe hold onto my shorts just a tad longer.
Isreal is building troops, and are expected to move into Lebannon this weekend, possibly tonight. At least it will happen while the markets are closed, so that we'll have a day or two for it all to begin before the Wall Street panic ensues. Here's to holding onto my shorts!
I suspect that the fighting in Isreal & Lebannon has upstaged the Fed Watch, as Treasuries are finally moving independent of the Fed Rate. I've got some Bonds at 4.9% (darn commisions!), so I say, "bring on the recession fears!". Fear of recession will raise my bond prices so I can eventually sell those and move back into equities. I've begun dabbling in day-trading and learning that I should maybe hold onto my shorts just a tad longer.
Isreal is building troops, and are expected to move into Lebannon this weekend, possibly tonight. At least it will happen while the markets are closed, so that we'll have a day or two for it all to begin before the Wall Street panic ensues. Here's to holding onto my shorts!
Thursday, July 20, 2006
Bounce over already?
I thought today would be a slightly up day instead of the down day it became. We had some up time in the morning, but now we appear to be back on track with the downward spiral the markets have been following. Yesterday's correction was the result of an oversold condition from the previous 3 days. But today's behavior implies that yesterday's correction may have been overdone as well.
Frankly, I think it all points to the common signals these days that investors/traders are very jittery in all markets, countries, and currencies. People aren't letting gains & losses spread too far before they take their money back off the table. I have no idea which way the market might go tomorrow, although I'm suspecting a down day. The indicators that I watch remind me of the instruments on an aircraft panel: they're more accurate when you're cruising. But when you start changing directions, or you're decending slowly in a nose-high attitude (like when you're landing), the instruments get less accurate as the air flow is no longer flowing smoothly into the pitot tube.
Right now, I feel like the market pulled up a little too hard and is going through a bit of a "stall". And the only way to recover from a stall is to get the nose back down...
I'm short across the board: KEA, VOL, LCRD, & MAT. I've been waiting 3 days to short MAT, but it looks like I should have waited only 2 since I couldn't watch it all day. I might drop the VOL in exchange for one or some of the recent movers: AVCI, RIMG (go short), & MOGN (go long).
BERYL: My house is in Florida, my job is in Connecticut. I can't get away from these hurricanes! But I'd rather be here than on the West Coast. Nothing personal, East Coast is just home.
Frankly, I think it all points to the common signals these days that investors/traders are very jittery in all markets, countries, and currencies. People aren't letting gains & losses spread too far before they take their money back off the table. I have no idea which way the market might go tomorrow, although I'm suspecting a down day. The indicators that I watch remind me of the instruments on an aircraft panel: they're more accurate when you're cruising. But when you start changing directions, or you're decending slowly in a nose-high attitude (like when you're landing), the instruments get less accurate as the air flow is no longer flowing smoothly into the pitot tube.
Right now, I feel like the market pulled up a little too hard and is going through a bit of a "stall". And the only way to recover from a stall is to get the nose back down...
I'm short across the board: KEA, VOL, LCRD, & MAT. I've been waiting 3 days to short MAT, but it looks like I should have waited only 2 since I couldn't watch it all day. I might drop the VOL in exchange for one or some of the recent movers: AVCI, RIMG (go short), & MOGN (go long).
BERYL: My house is in Florida, my job is in Connecticut. I can't get away from these hurricanes! But I'd rather be here than on the West Coast. Nothing personal, East Coast is just home.
Wednesday, July 19, 2006
Update, Thursday's watch list
BCGI and KEA have reversed their downward trends today with massive gains. Relative Strength for BCGI is reaching its limits, and KEA might have another 3-5 days before it begins to correct.
RSI is only one indicator I'm looking at, but all the indicators point to some loser-stocks getting seriously overbought. Actually, BCGI looks like it's forming one of those 'cup & handle' patterns.
If I can do this right, I might gain back all that money I spent learning about options with UNH.
About charts and TA, Cramer had an excellent quote today for all us chart & TA learners out there:
If an analyst doesn't like a chart, he'll just draw a different line and explain it all over again.
Ha! Ha! I knew I kept watching that show for SOME reason!
RSI is only one indicator I'm looking at, but all the indicators point to some loser-stocks getting seriously overbought. Actually, BCGI looks like it's forming one of those 'cup & handle' patterns.
If I can do this right, I might gain back all that money I spent learning about options with UNH.
About charts and TA, Cramer had an excellent quote today for all us chart & TA learners out there:
If an analyst doesn't like a chart, he'll just draw a different line and explain it all over again.
Ha! Ha! I knew I kept watching that show for SOME reason!
Subscribe to:
Posts (Atom)