So, 4 years since my last post and they haven't deleted me yet. Hmmm, I'll have to start making it worth their while. Got some new systems put together that I'd like to try out, and maybe I'll show off a few things for the scan-bots that read this site.
Off to NYC for the week, though. So nothing until later. Cheers!
Monday, March 21, 2016

Tuesday, June 26, 2012
General Update, 2012/06/26
The general trend is still DOWN for long-term indices. IWM is playing out a small rising wedge, which may bottom around 75.00. After that, I'll be watching to see if this is the rounding point for the final, election time rampup before the next great pop.
Still holding TZA, looking for a 72.00 IWM exit point unless we recover sooner.
Friday, June 08, 2012
Friday, May 25, 2012
Coming back
I'm thinking of coming back to blogger for various reasons. This is a trial post from my new mobile device, and I wonder how I'll get charts on here now.
Tuesday, March 29, 2011
Time For Change
I'm going to start posting at SharePlanner.com. They already have membership and a good forum started, so I expect to get more feedback from my posts. You can find me listed as, "Edgy".
Sunday, February 13, 2011
Weekly Technical Analysis
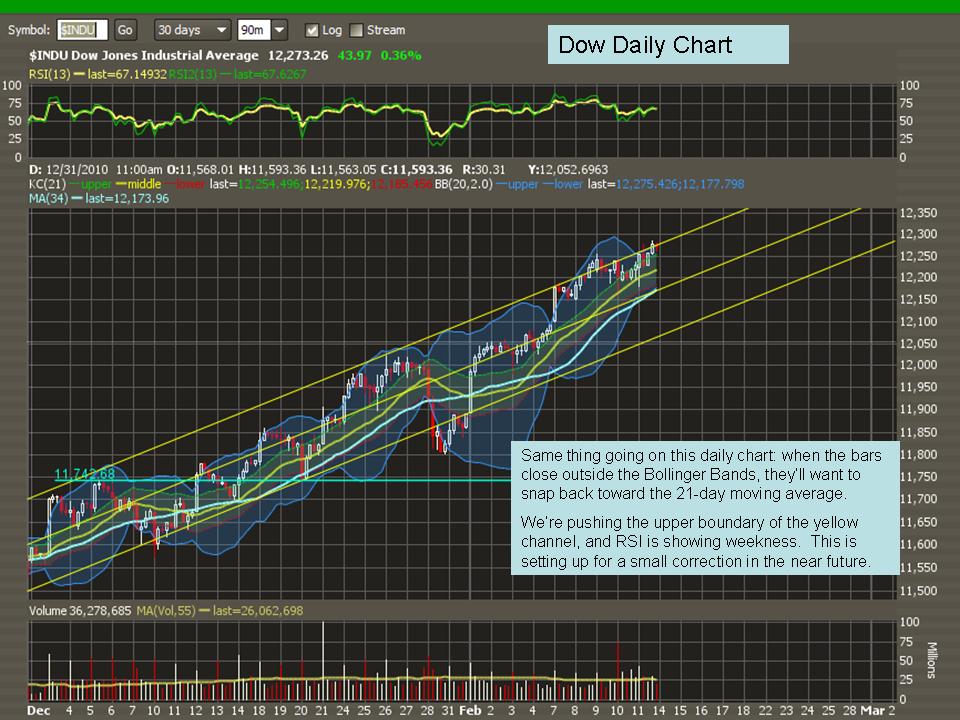
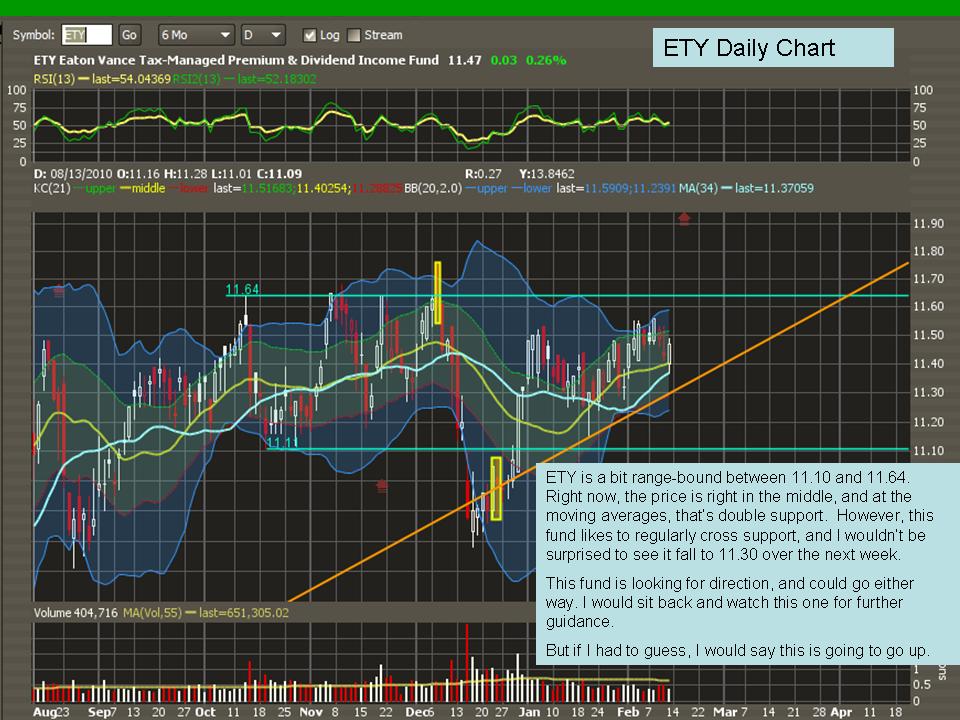
I've been looking at some mutual funds for a buddy at work. I figured I might as well post them for the sake of keeping up with this blog.
In short, this week looks like it's setting up to be flat or down for the big Indices. But the POMO has proven me wrong over and over again.



Wednesday, December 15, 2010
Wass Happenin?


I'm already stopped-out of ANH, and just got in NTRZ.
KKD is looking good, and the indices already did a headfake this morning.
Here's to an even lower-volume Christmas rally!!!
Friday, November 12, 2010
Crash Course
I recently discovered Chris Martensen's Crash Course lecture series. Here's an excellent explanation on how the Fed creates money:
Tuesday, November 09, 2010
Actual News Event Mistaken for Onion Video
I was watching the following video at work when my neighbor asked me if this was another Onion News Video. I don't know if that's more scary than the news itself! This news clip reminds me of the beginning of some of those movies where they would show the news footage back "before it all happened", if you know what I mean.
I couldn't get the video to embed, so CLICK HERE FOR VIDEO. It's the one about the mysterious missile launch off California last night.
Commodities were rocking this morning, looks kinda like they hit the tipping point. In honor of the oncoming Christmas spirit, I submit the following:
Monday, November 01, 2010
Kicking and Screaming
Can you spot the differences between the two images below?


I have never seen so many long-tail doji days all together like that, with decreasing volume to boot! This Market is hellbent on indecision, and is going to have to be dragged into making a decision, up or down.
I'd say they just "pulled a Congress", referring to the guys who just refused to pass a Budget before adjourning for Election Season, because they didn't want it to influence voters. Just like the conspiracy theorists (who are probably right) say that the Fed has been pumping the Indices in advance of Elections to boost the incumbants' chances. Looks like it's a fat chance now, and the excuse for this relentless melt-up is now due to frontrunning of QE II: The Wrath of Tim (Geitner).
I'm STILL short, and at a loss. Right now, I feel like quite the dumbass as I look at my P&L. But, since we're still flatlining in Index prices, I don't see any reason to pull out just yet. I've got a feeling that I'll get that climactic release by the end of this week, and I'll know if I'm smarter or dumber-er.
Wednesday, October 27, 2010
Is this all on the UUP and UUP?
So, I was looking at the blog and how often I have NOT been posting the past year. It's been very stressful with the combination of market ups and downs, President Obama and Congress officially cancelling my job, the Constellation Program, and the passing of my dear grandmother.
I come across a year-old chart of UUP that I posted, and almost thought that I was looking at today's chart! We're back to the same price levels, and the past year's data looked strikingly similar. I pulled up the current chart, marked up both for comparison, and posted below.
THEN:

I see a VERY DIFFERENT setup in today's action. Last year, there was a well-defined trendline that was eventually broken with supporting info from the indicators. There's a lot of up-pointing arrows on this first chart, showing positive divergence.
NOW:


Today's chart shows a year of much more wild behavior. While a similar trendline is respected, the other indicators aren't really giving any signals, all except volume. Volume is supporting hope for a bottoming out and reversal. We still need to penetrate (huh huh) that trendline, though. It's like a squished version of the first chart, more caffeinated and energetic. Another good sign is that price has gone above the 20-day MA. Let's see if it can cross the 50-MA.
Remember that this is an ETF that follows the Dollar Index. The whole world is in play here, and this is a simplified version of where the US is related to everyone else.
Another thing I noticed, Stockcharts.com has added price tags to the right side of their free charts in the past year. Sweet.
Tuesday, October 26, 2010
QE2 in Q4
The past two months of monster stock price rises are being attributed to inflation of stocks due to the falling dollar. The Fed has been pumping money by the billions daily into the world economy through POMO, and you can compare the inverse relationship between the Dollar Index to the S&P 500.
Traders are talking about just staying out of the market, and blaming all the noise on high frequency trading algorithms. And now I've heard two different guys in radio interviews claim that the rising prices aren't due to current POMO pumping, but due to anticipation of the upcoming Fed's Quantitative Easing, Part II; also known as QE2, or QE Lite.
I've been looking for turnaround signs to cause the market to dip back again, probably right after the elections on November 2. Marc Faber suggests that the signal won't be elections results, but the Fed announcement.
I am currently short, and I'm sweating for jumping in too soon! But the thing I'm starting to notice is that the Russel 2K is staying flat, while the Dow and S&P are fluctuating more wildly. There is a dissonance forming between the indices, and I think it's the cracks starting to form.
An Answer to the Previous Post
I found this video on etf-central.com recently. It shows that China is actually not THE big holder of our debt, but one of three. The "Other" category is supposed to be the rest of the world outside of the U.S.
Holders of Treasury Securities, 2004-2010 from Computational Legal Studies on Vimeo.
Friday, October 22, 2010
Staring Down Destiny
I thought I'd come back from the shadows to post this link to a very concerning video. It explains how I've been feeling for the past year or so, and how I have been approaching my investing. I am currently bearish, but cautious of the rising trend in the Indices due to POMO hand-pumping.
Wednesday, May 19, 2010
Nicolas Darvas
How I Made $2,000,000 in the Stock Market by Nicolas Darvas is my latest read. I just came across this line at the end of Chapter 3, and wanted to repeat it here:
"What, I asked myself, was the value of examining company reports, studying the industry outlook, the ratings, the price earnings ratios? The stock that saved me from disaster was one about which I knew nothing. I picked it for one reason only -- it seemed to be rising."
"What, I asked myself, was the value of examining company reports, studying the industry outlook, the ratings, the price earnings ratios? The stock that saved me from disaster was one about which I knew nothing. I picked it for one reason only -- it seemed to be rising."
Monday, May 17, 2010
Greecy French Fries
My godmother recently passed away, leaving me with her interest in several assets. If given the chance to liquidate some of these assets at actual, par value, then I may finally get a chance to start that full-time investment company (a.k.a. hedgefund) that I've been planning. If that ever happens, I'm going to make my traders dress up like superheroes and work in a spacious office surrounded by computer equipment that I'll buy surplus from the 1960's. I think it'll look a little something like this:
Tuesday, March 02, 2010
Out of the xBox
Guess what I got for Christmas? Here's a hint:

Now that I've got first Prestige, level 70, and Fall camo for the Intervention, I figured I'd look at the charts again to try and make heads or tail of what's going on. Ok, ok, I've been watching the whole time. So, here's where I am right now:
I recently bought the dips on AVF, DMND, and ETW. I tried to get KKD on a second dip to 2.51, but it never happened and it took off while I watched in the cloud of dust. I'm still watching it, looking for a dip-buy opportunity.
I've already sold DMND for a quick profit, and I'm still watching it for a second entry opportunity. It looks like a rising wedge that's ready to break.
There's a limit order to dabble in some CNOA at $.90, which has been hovering at $.901 for 2 hours now.
The traders I listen to are trending in the positive direction for the markets right now. I don't know how they see it, but I'm trusting their judgement (with stops, of course) while I try to figure out what they're seeing. Meanwhile, I'll be studying the basics again to engrave Chart Patterns 101 in my mind.
Hat tip to Traderstewie for the training session:
Link Here
Cheers.
If anyone happens to read this, my XBOX Live tag is R4ND0M THR33.

Now that I've got first Prestige, level 70, and Fall camo for the Intervention, I figured I'd look at the charts again to try and make heads or tail of what's going on. Ok, ok, I've been watching the whole time. So, here's where I am right now:
I recently bought the dips on AVF, DMND, and ETW. I tried to get KKD on a second dip to 2.51, but it never happened and it took off while I watched in the cloud of dust. I'm still watching it, looking for a dip-buy opportunity.
I've already sold DMND for a quick profit, and I'm still watching it for a second entry opportunity. It looks like a rising wedge that's ready to break.
There's a limit order to dabble in some CNOA at $.90, which has been hovering at $.901 for 2 hours now.
The traders I listen to are trending in the positive direction for the markets right now. I don't know how they see it, but I'm trusting their judgement (with stops, of course) while I try to figure out what they're seeing. Meanwhile, I'll be studying the basics again to engrave Chart Patterns 101 in my mind.
Hat tip to Traderstewie for the training session:
Link Here
Cheers.
If anyone happens to read this, my XBOX Live tag is R4ND0M THR33.
Wednesday, November 18, 2009
UUP with Ben!

Ok, ok... so I'm not a whiz with Photoshop; you get the point. It's after 2 AM and I finally finished the image I had in my head this weekend.
I've noticed other traders are talking about throwing their hands up in disbelief in this rally. We all know it's tied to the dollar, and all the money that's getting conjured up and thrown into Treasuries. I've been in and out of UUP and some other small stocks that I was watching for patterns, like KKD.
Speaking of which, WTF happened with KKD today? I sold in the panic this morning, as it dropped lower and held it for most of the day. Then, in the afternoon it took off and closed higher for the day. Sheesh!
Update: I'm out of KKD, still riding HW, and now have a spot of TIV. I was thinking of getting back into UUP, but that ticker moves so slow that it would probably be better to find some other vehicle to ride any kind of dollar comeback. Then again, I might have a while to look for one if this death-defying rally continues.
I heard an interview with Tom McClellan of the McClellan Oscillator Clan, on The Disciplined Trader podcast. I liked what both of the guests said that I listened to the show twice. But the reason I bring it up now is because Tom McClellan mentioned that he forecasts a dip in the US markets through much of December. He even went so far as to say that we might go back to screaming 'doom & gloom' before it bottoms, even though it won't go farther down than maybe what it was in July. So, I'll be keeping that in mind for the next month or so.
Alright, gotta go to work in a few hours, time for some sleep.
Thursday, November 12, 2009
Power UUP
Looks like the Dollar is trying to make a comeback en force. Today's move bounced it off the 20MA and punched through the 50MA. Last time, it was stopped by the 100MA, which now stands at 23.12. Rising past this barrier and continuing on may spell doom for the local markets as long as the Dollar-Stock Market inverse relationship continues.

But if it does go though, I'll be interested in learning the reasons why. I've been hearing a lot of noise about a Dollar carry trade, which could make dollars 'worth' more. But that didn't really seem to work for Japan. Then again, we're not Japan.... read it how you like.
On a tip from the ChartAddict I bought some PLA today.

I had actually been watching this one as it was forming a nice Holy Grail setup, easing back down to the 144MA. But I didn't check back in time, and I got in at 4.00. Right now, I'm losing in the aftermarket, and I found out later that the jump was due to news that Playboy might get bought out. This was a rumor play, and I might have moved in too late. Support is at 3.82, so that's where I'll start to sweat. Otherwise, I'm going to see how this 'plays' out.
I dumped GSX at .48, and I might have to wait until December to see if it will bottom out. Trendline support is still only around .45 or so, but that's a healthy 7% for this penny pincher!

I also might include a short of the Dollar/Yen through the FXY etf. Don't know if I'll be able to short that etf until I try, and I'm still watching for a few more weeks as it approaches resistance. The wedge it's riding in now has such a low slope, it might not be until January or almost February before the Yen falls. Say, is there a Euro/Yen etf out there for us to buy?


But if it does go though, I'll be interested in learning the reasons why. I've been hearing a lot of noise about a Dollar carry trade, which could make dollars 'worth' more. But that didn't really seem to work for Japan. Then again, we're not Japan.... read it how you like.
On a tip from the ChartAddict I bought some PLA today.

I had actually been watching this one as it was forming a nice Holy Grail setup, easing back down to the 144MA. But I didn't check back in time, and I got in at 4.00. Right now, I'm losing in the aftermarket, and I found out later that the jump was due to news that Playboy might get bought out. This was a rumor play, and I might have moved in too late. Support is at 3.82, so that's where I'll start to sweat. Otherwise, I'm going to see how this 'plays' out.
I dumped GSX at .48, and I might have to wait until December to see if it will bottom out. Trendline support is still only around .45 or so, but that's a healthy 7% for this penny pincher!

I also might include a short of the Dollar/Yen through the FXY etf. Don't know if I'll be able to short that etf until I try, and I'm still watching for a few more weeks as it approaches resistance. The wedge it's riding in now has such a low slope, it might not be until January or almost February before the Yen falls. Say, is there a Euro/Yen etf out there for us to buy?

Wednesday, November 11, 2009
Modern Warfare 2 Released, Volume Low. Coincidence?
We don't have an XBox, and I surely can't afford $80 for COD6:MW2. So, I have time to work out some more trading techniques.
I've been starting with the weekly charts to find patterns, since my schedule prevents me from trading more frequently than daily. I've stuck my toe in the water with the following four tickers, and the charts are shown daily for a little more clarity.
UUP
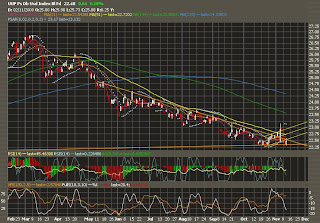
Boy, looks like I'm bucking the trend on this one. But I've thrown a little fundamental assumptions into this, since it's a Dollar Index follower. I jumped-in following the break in trend on good volume last week. I later found through ZeroHedge that the big spike might have been limited insider trading, and not actual capitulation. Notice that UDN didn't move in tandem, and only UUP was announcing more share issues.
Nevertheless, UUP is still fighting support at this time. There is one heck of a lot of noise on which way the Dollar is going to go from here, and most of it is bearish. So, I have my doubts, but I'm trying to make a point of ignoring the noise more and more, and just watching the charts. For now, I'm holding out and ready to pull the plug. One thing that gives me hope is that yesterday's candle sure looks suspiciously like a stop-sweep...which are often followed by swift moves in the opposite direction. But I've only found those intraday before.
KKD

I was so excited when Krispy Kreme went IPO about 10 years ago... it was around $18 and I wasn't even trading stocks yet then. It closed at $3.39 today and hasn't ever split. I remember thinking about how a share was only a dollar back in March, and wondering how many shares I could get for the price of a dozen "hot doughnuts now."
This chart shows a nice and steady uptrend that might also be a rising wedge. As long as this trend holds I'll keep confident all the way up to 4.38... where I'll keep holding through the 4th attempt to break support. From the first test on resistance, this chart actually looks like a cup and saucer formation brewing.
HW

Headwaters, I don't even know what they do. But this chart shows another rising wedge squeezed near the end, looking to break out. It appears that I may have jumped in a bit early, as there's more downside risk in this narrow range at the tip of the wedge. It also might be a failed pattern since resistance was broken for several days in October, but then failed to become support. This stock may be entering a new trend, but I've put my money in that this could be a bull-flag and the main trend will continue. There's low tolerance if this trend gets broken, however.
GSX

I bought Gasco thinking we might have a Holy Grail pattern off the 51 MA, and that's when I got in. Unfortunately, the 51 MA has been broken and I have to count on the upward trend holding out. This is a penny stock, so moves either way could be severe. Keep the safeties off.
I've been starting with the weekly charts to find patterns, since my schedule prevents me from trading more frequently than daily. I've stuck my toe in the water with the following four tickers, and the charts are shown daily for a little more clarity.
UUP

Boy, looks like I'm bucking the trend on this one. But I've thrown a little fundamental assumptions into this, since it's a Dollar Index follower. I jumped-in following the break in trend on good volume last week. I later found through ZeroHedge that the big spike might have been limited insider trading, and not actual capitulation. Notice that UDN didn't move in tandem, and only UUP was announcing more share issues.
Nevertheless, UUP is still fighting support at this time. There is one heck of a lot of noise on which way the Dollar is going to go from here, and most of it is bearish. So, I have my doubts, but I'm trying to make a point of ignoring the noise more and more, and just watching the charts. For now, I'm holding out and ready to pull the plug. One thing that gives me hope is that yesterday's candle sure looks suspiciously like a stop-sweep...which are often followed by swift moves in the opposite direction. But I've only found those intraday before.
KKD

I was so excited when Krispy Kreme went IPO about 10 years ago... it was around $18 and I wasn't even trading stocks yet then. It closed at $3.39 today and hasn't ever split. I remember thinking about how a share was only a dollar back in March, and wondering how many shares I could get for the price of a dozen "hot doughnuts now."
This chart shows a nice and steady uptrend that might also be a rising wedge. As long as this trend holds I'll keep confident all the way up to 4.38... where I'll keep holding through the 4th attempt to break support. From the first test on resistance, this chart actually looks like a cup and saucer formation brewing.
HW

Headwaters, I don't even know what they do. But this chart shows another rising wedge squeezed near the end, looking to break out. It appears that I may have jumped in a bit early, as there's more downside risk in this narrow range at the tip of the wedge. It also might be a failed pattern since resistance was broken for several days in October, but then failed to become support. This stock may be entering a new trend, but I've put my money in that this could be a bull-flag and the main trend will continue. There's low tolerance if this trend gets broken, however.
GSX

I bought Gasco thinking we might have a Holy Grail pattern off the 51 MA, and that's when I got in. Unfortunately, the 51 MA has been broken and I have to count on the upward trend holding out. This is a penny stock, so moves either way could be severe. Keep the safeties off.
Subscribe to:
Posts (Atom)